DASHBOARD
The charts included in this ‘dashboard’ show resources that have been used to grow food on the area cultivated with edible crops and the quantity of food that has been grown over two years, during 2019 and 2020. The last two sections of this page are dedicated to transport and the perceived immaterial benefits accrued through gardening. We decided to include transport in these charts because the fuel that is sometimes used for transport adds to the resources used to grow food.
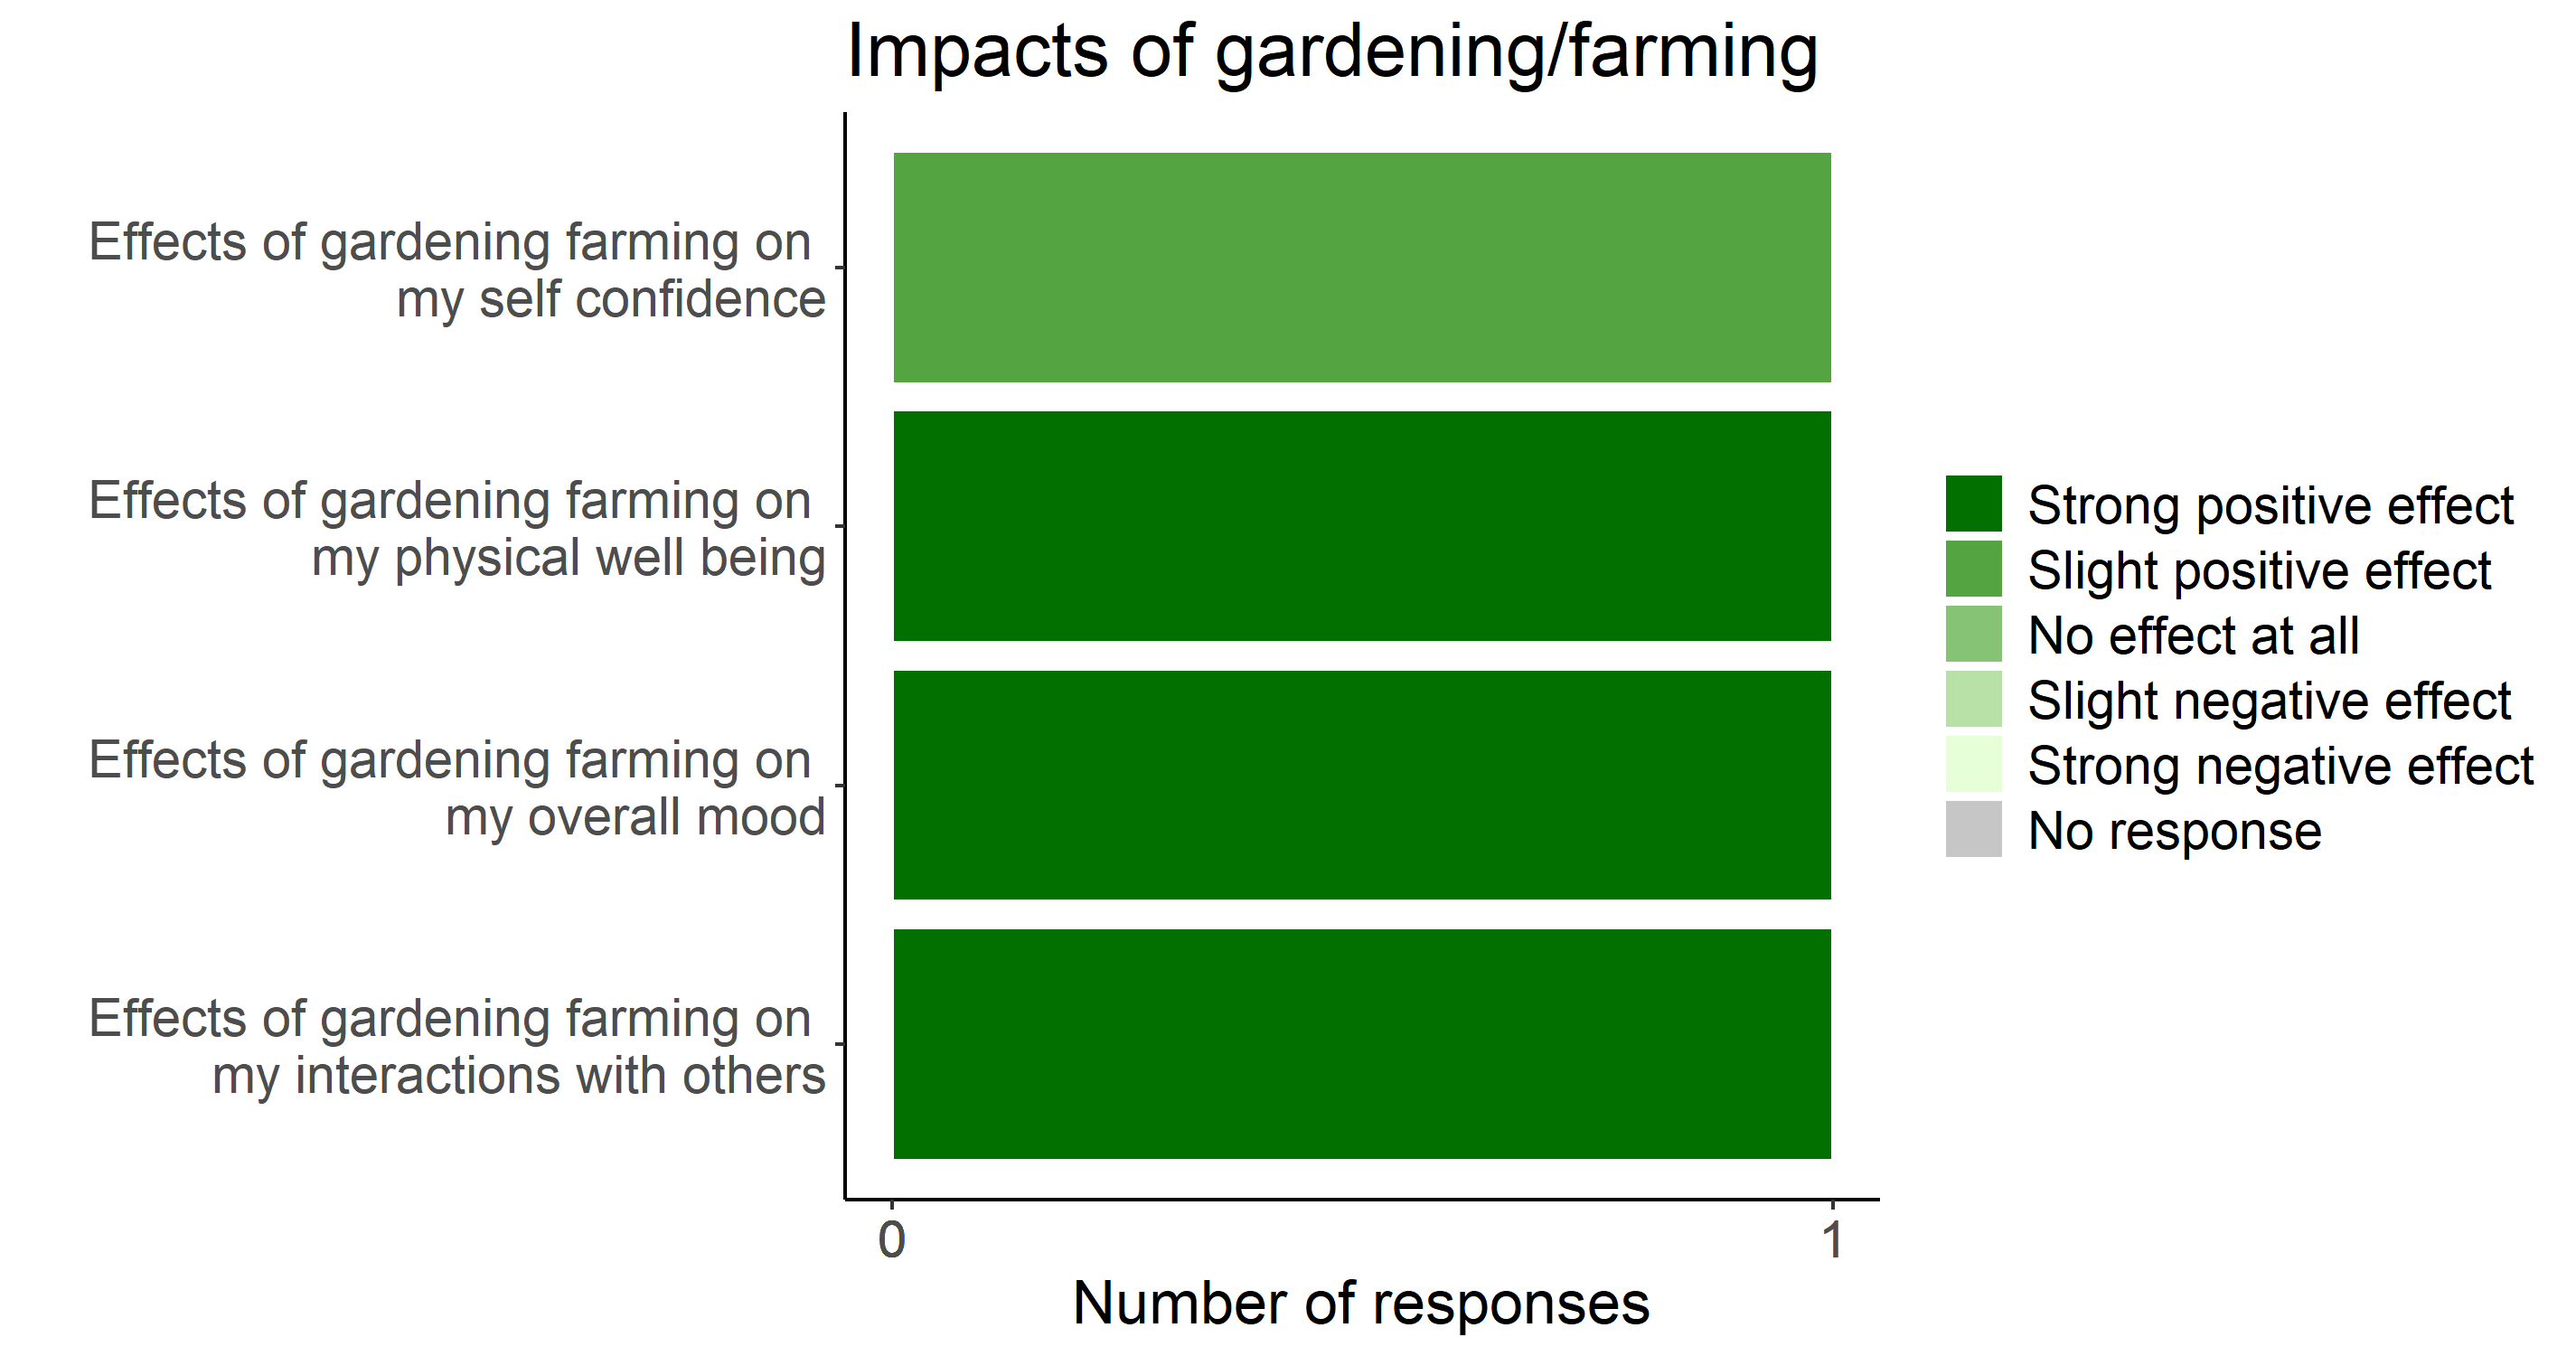
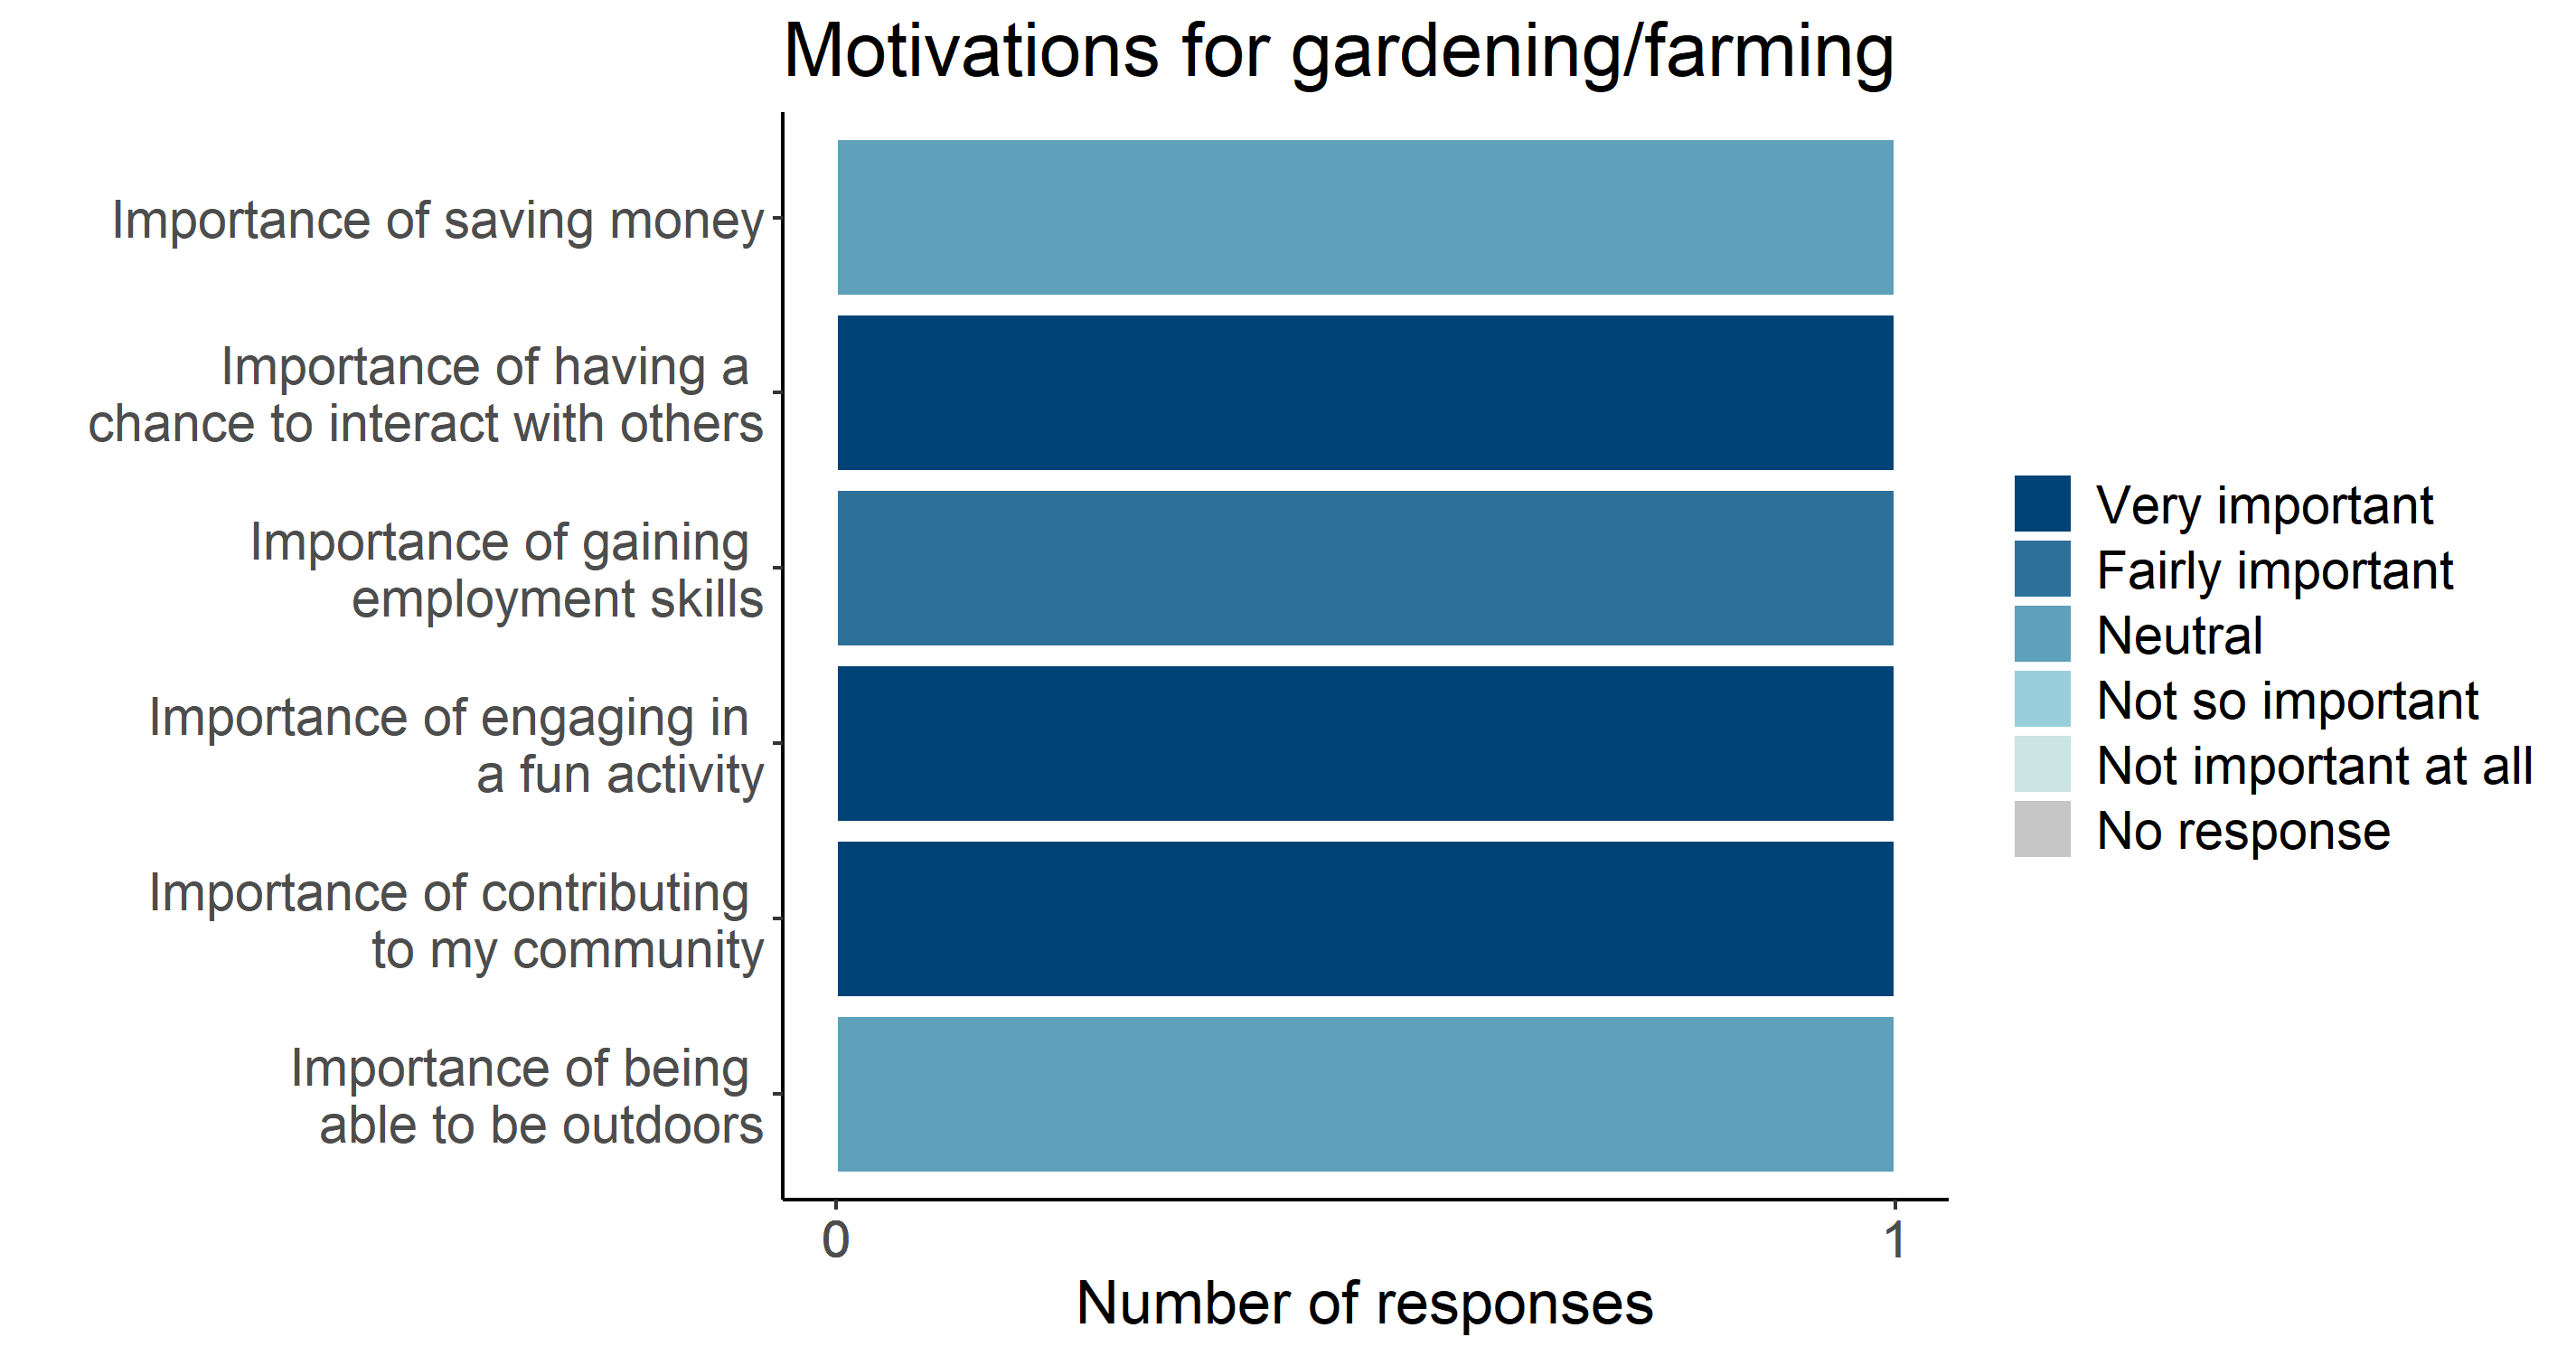
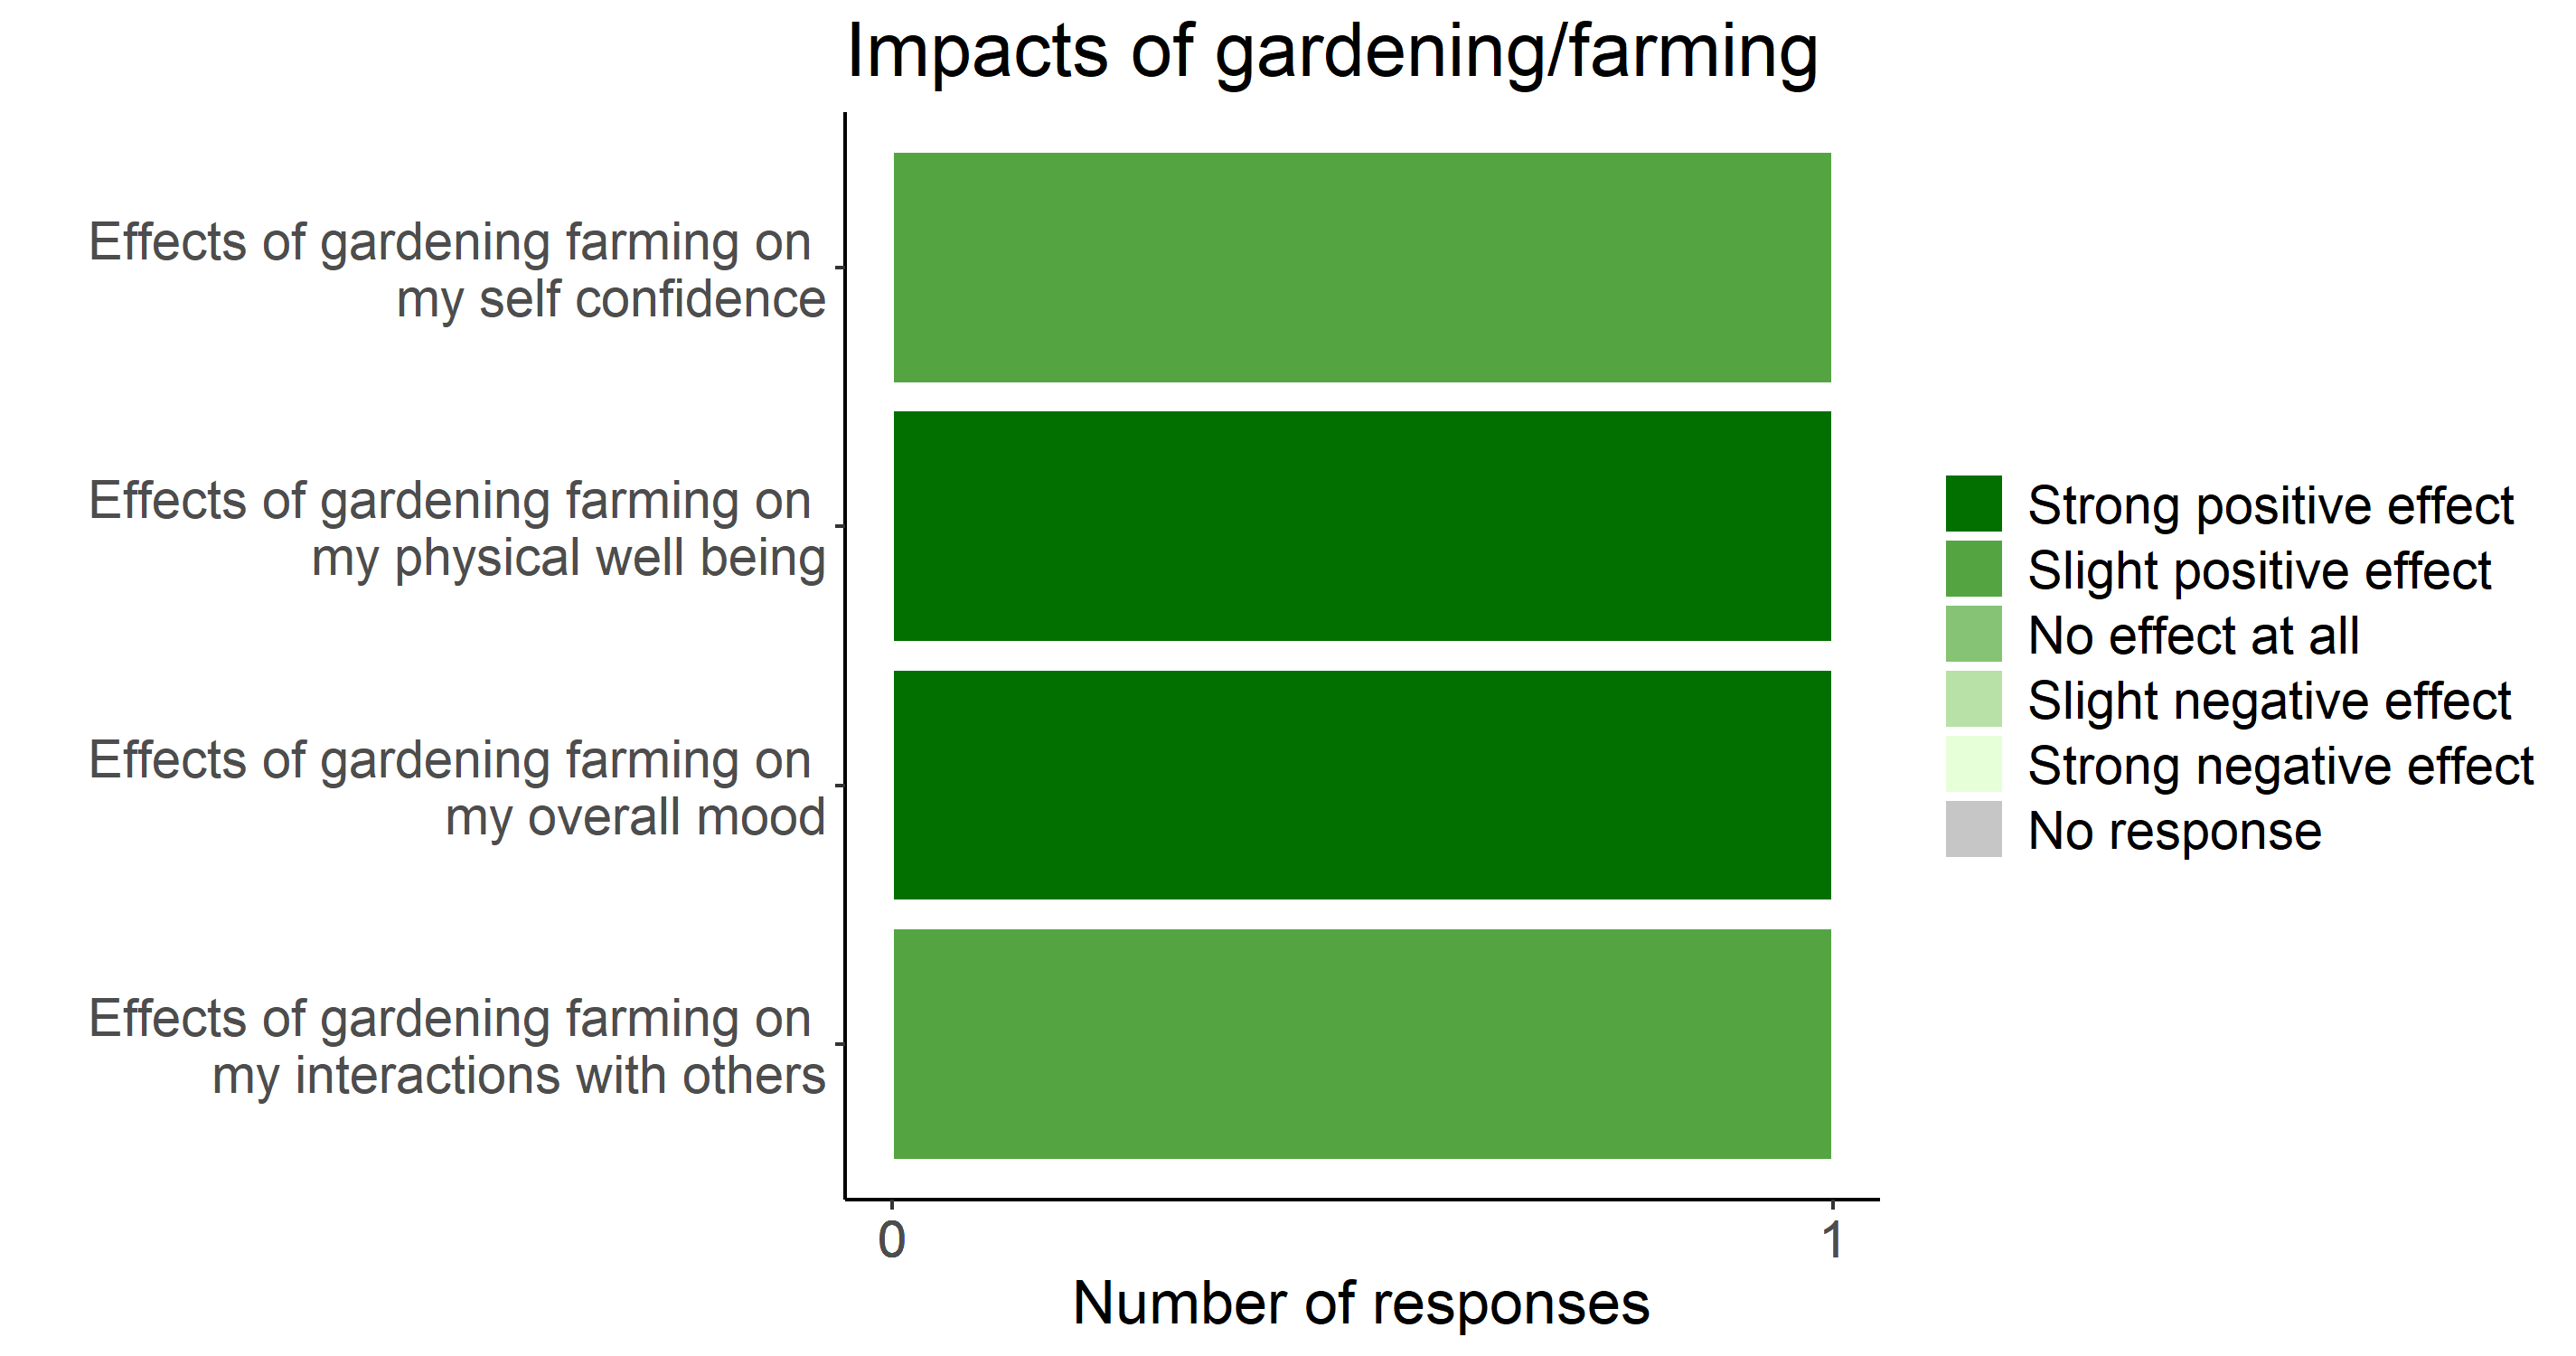
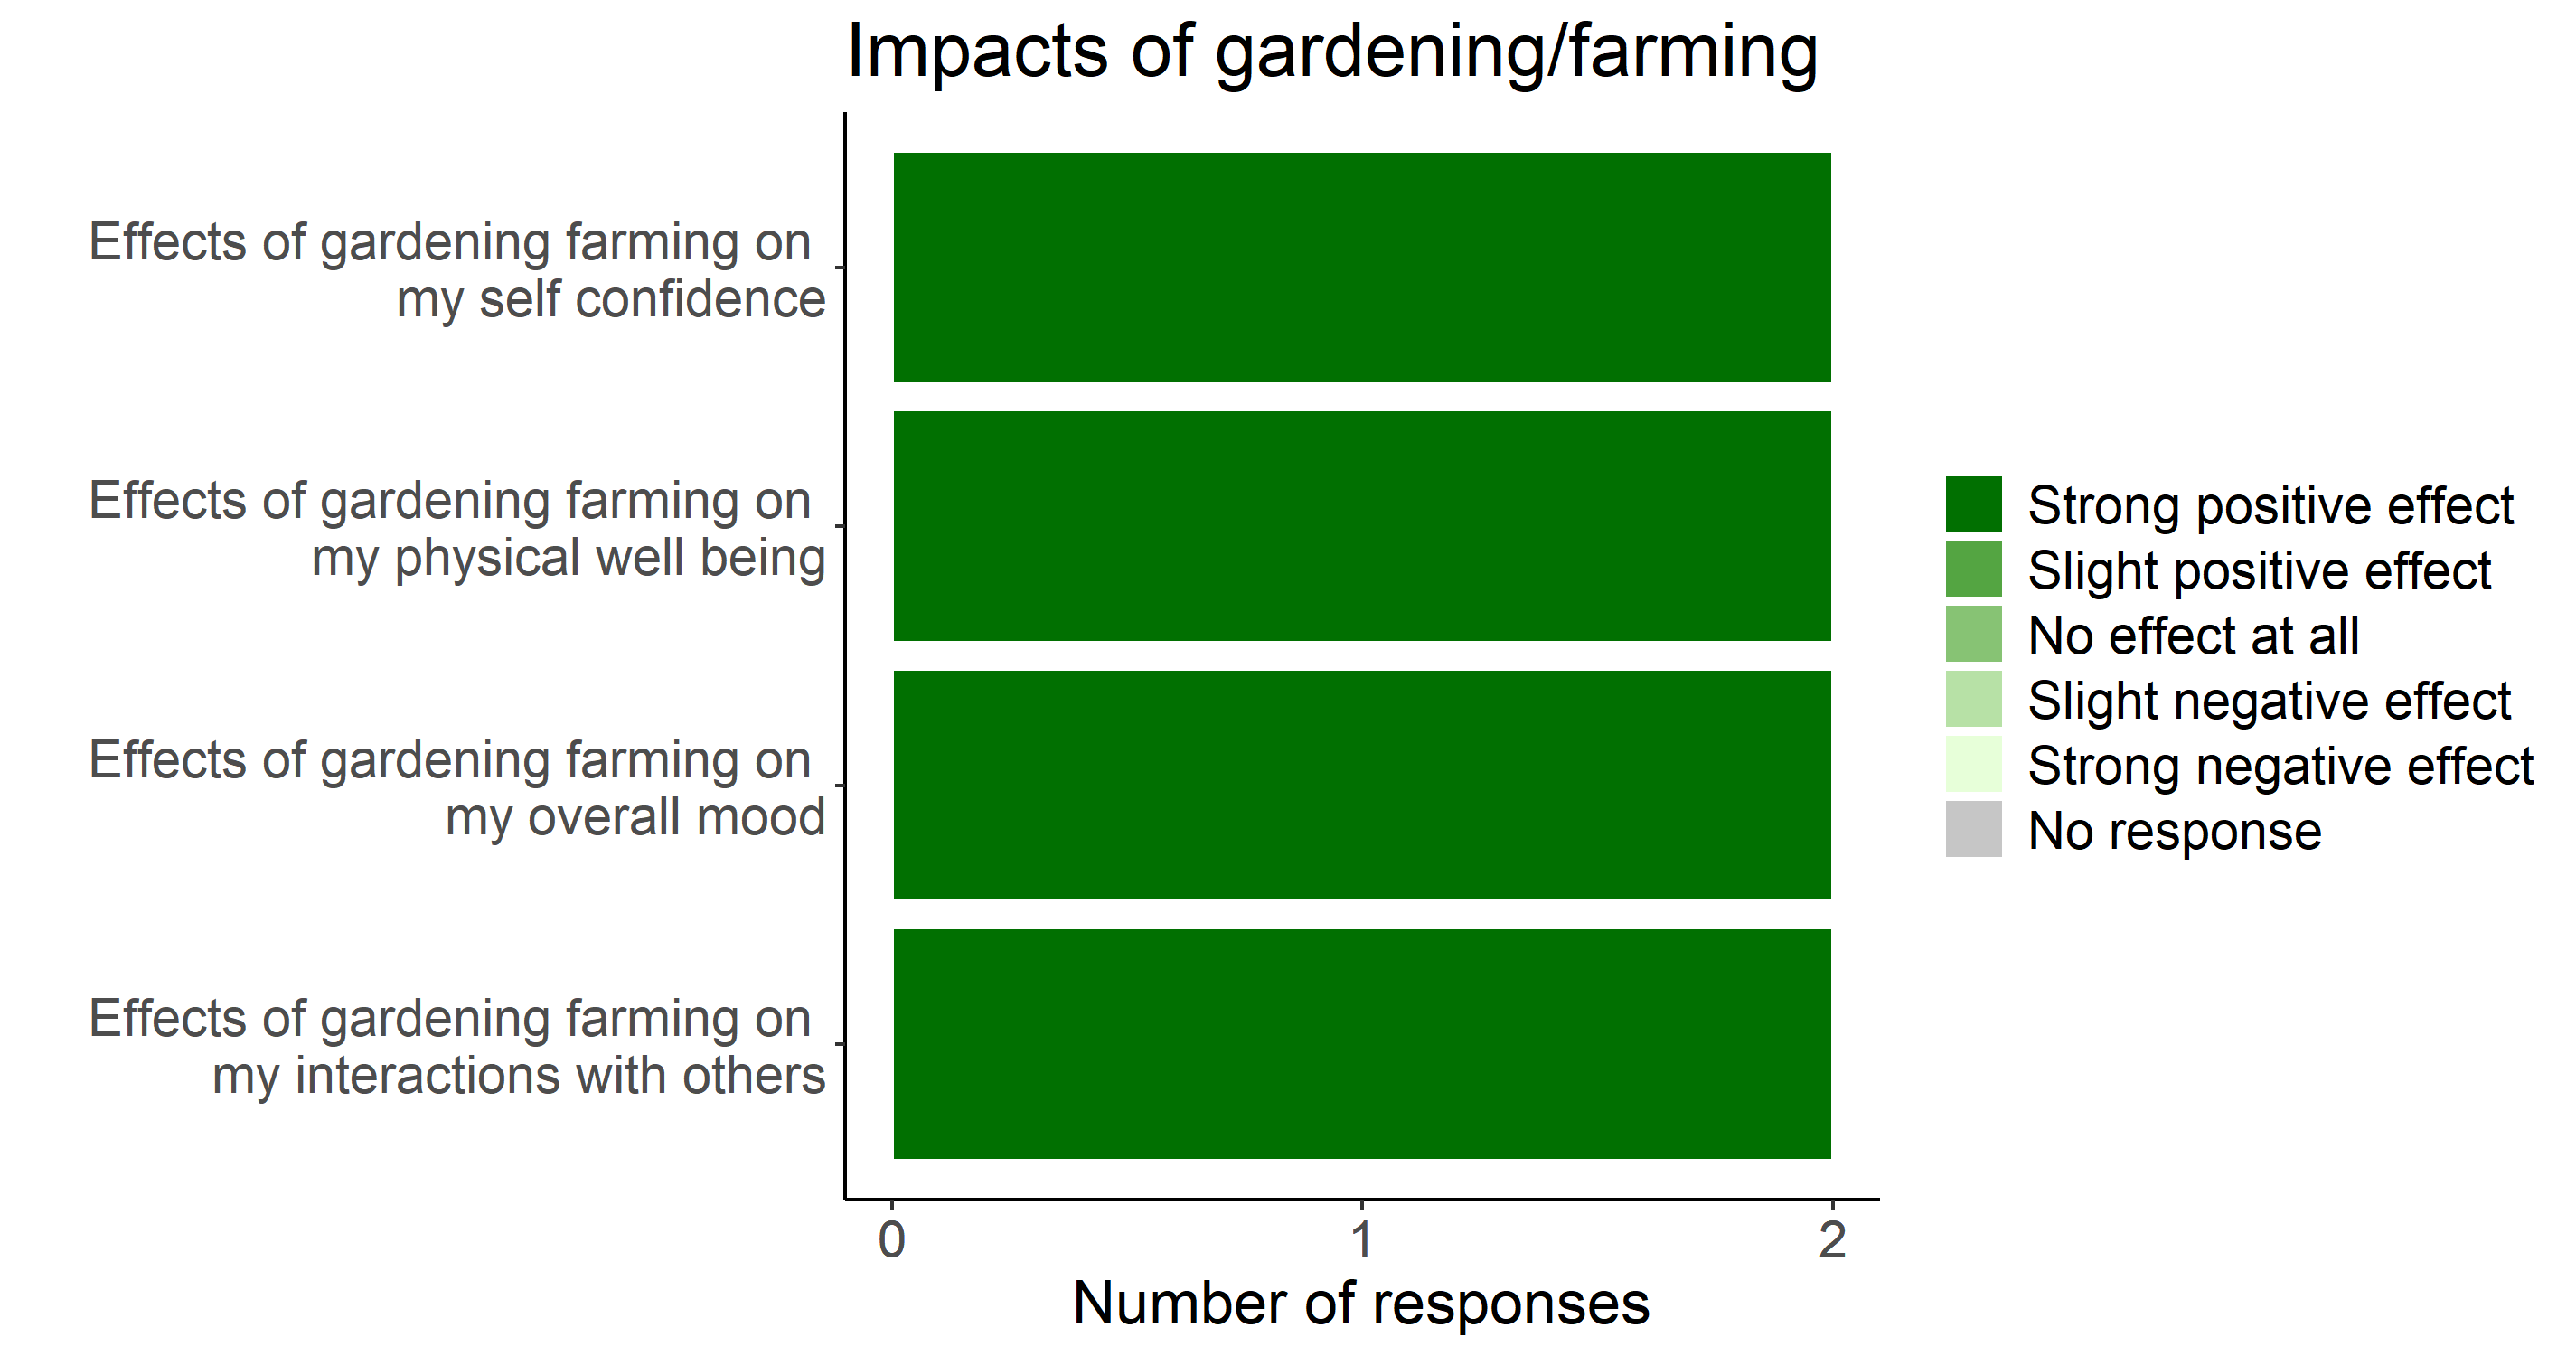
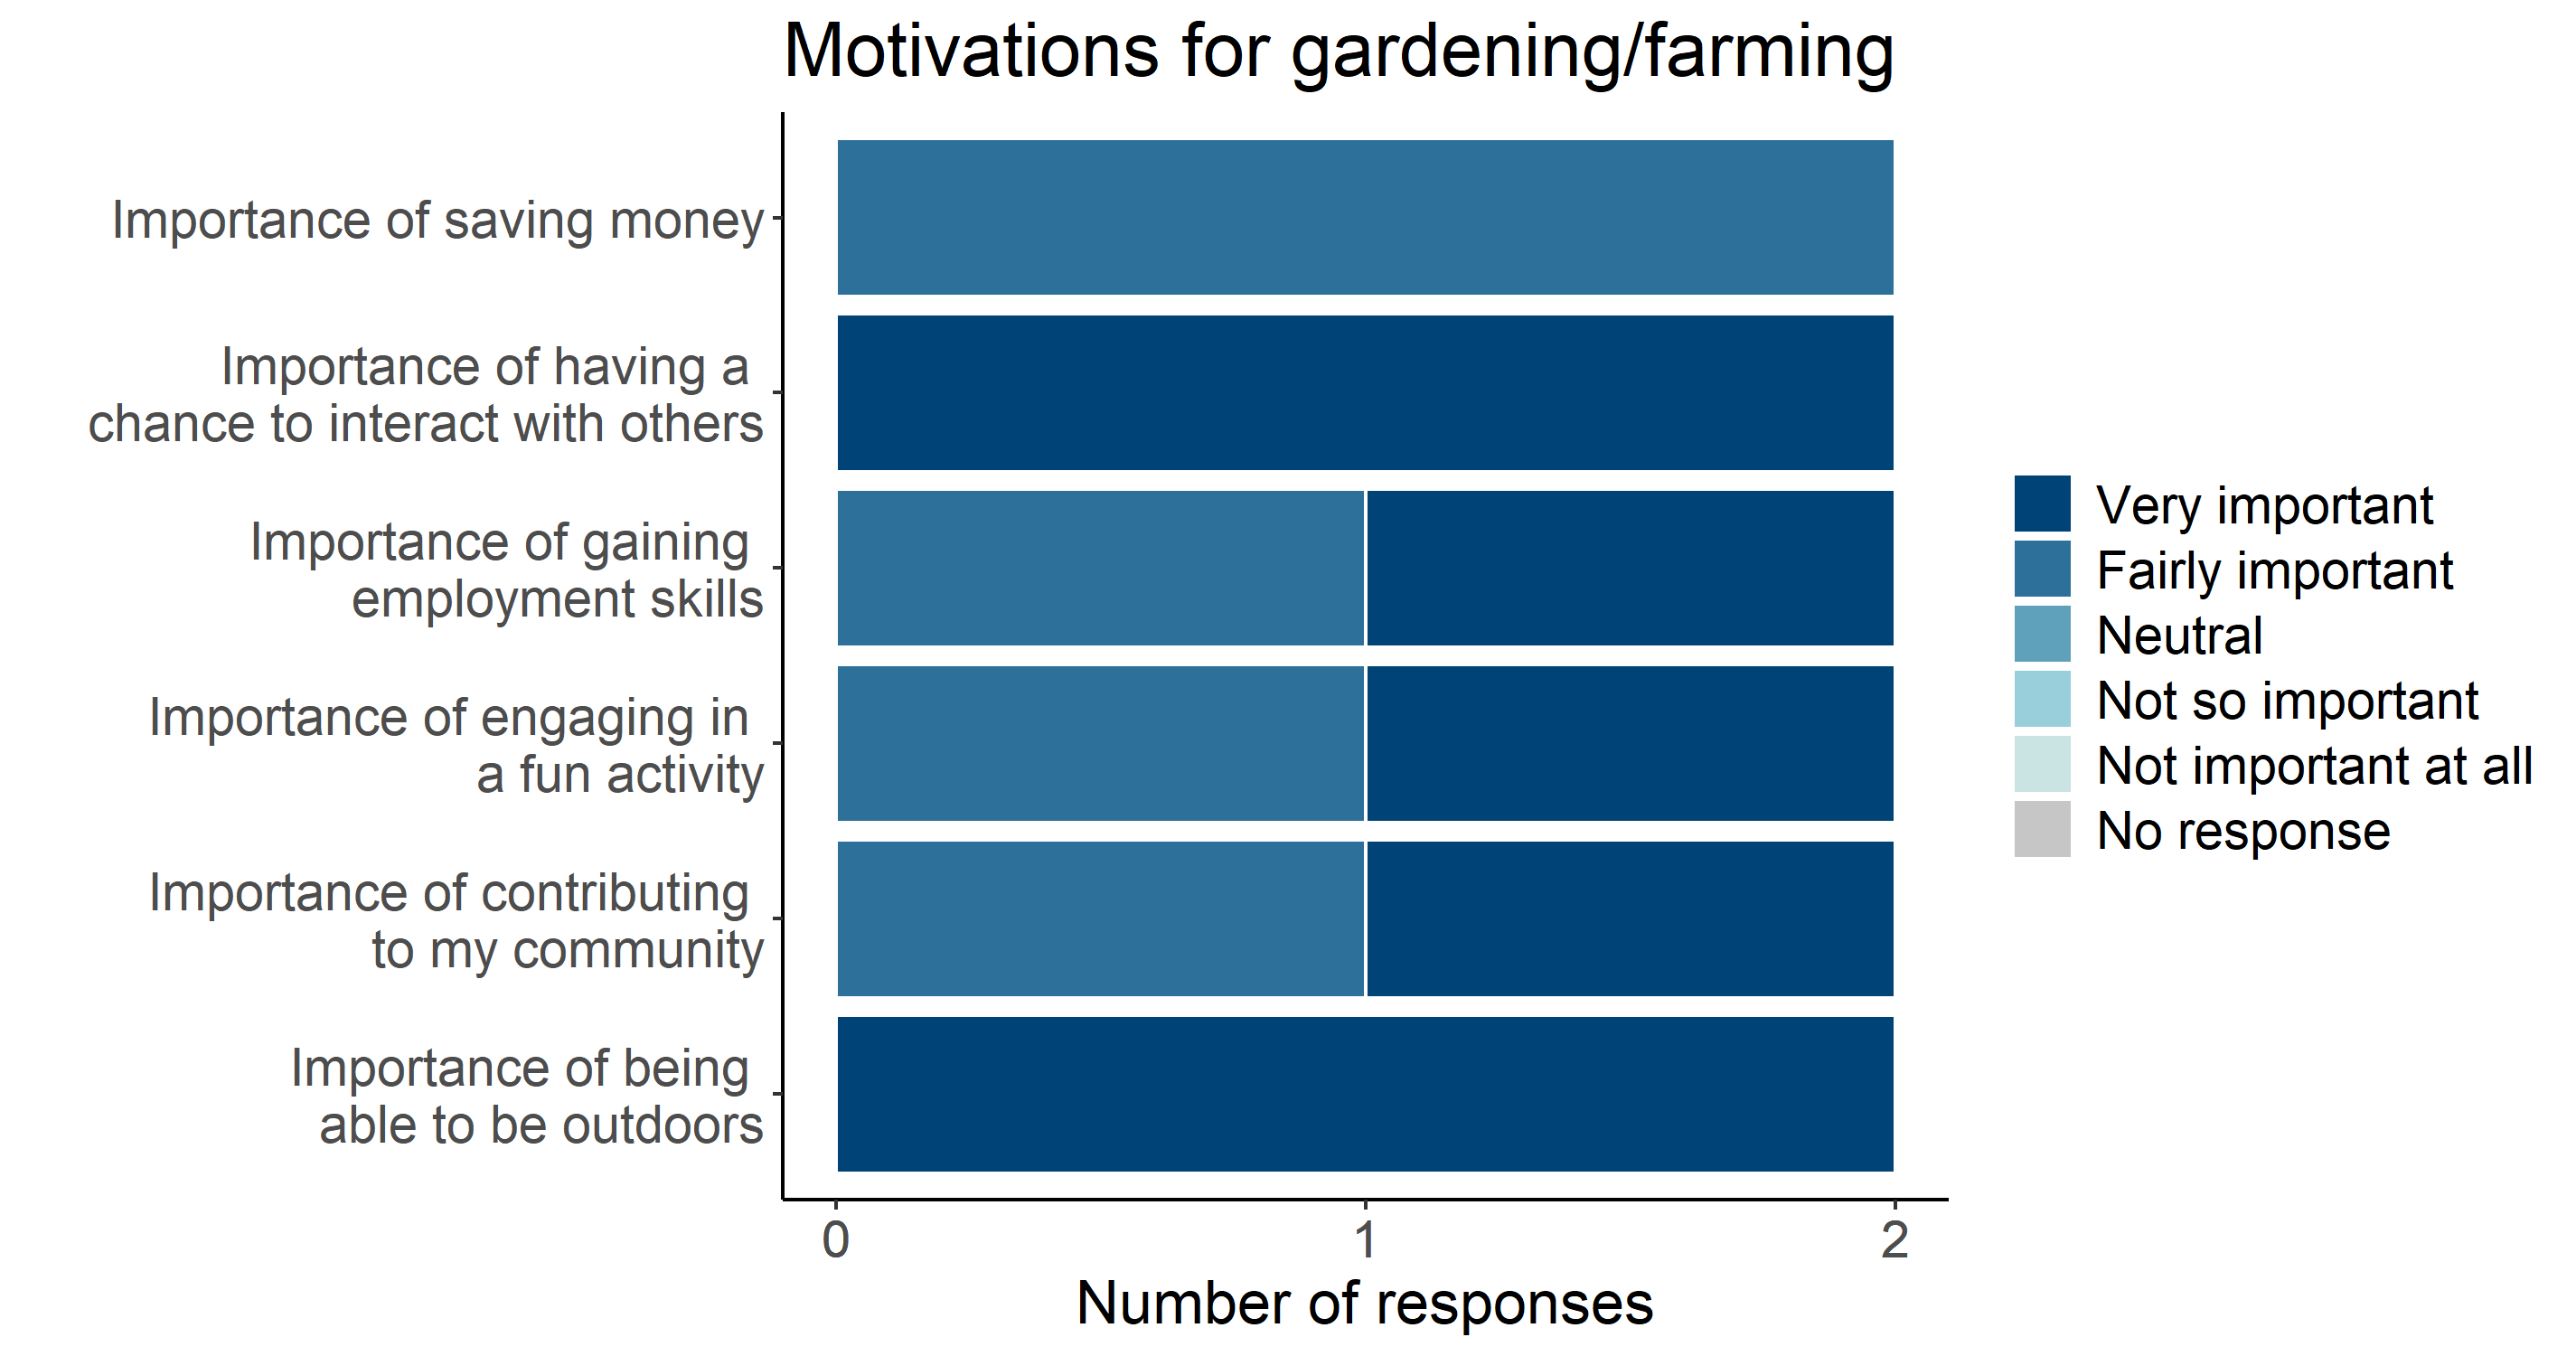
In the last section of the page, two charts show immaterial benefits in terms of motivations for our gardeners to work in this community garden and the impact that this work generates on their health, socialisation and more. Transport, motivations and impacts were identified on the basis of a survey amongst gardeners and volunteers conducted in 2019.
All charts are based on the data that gardeners have collected with much dedication.
WATER
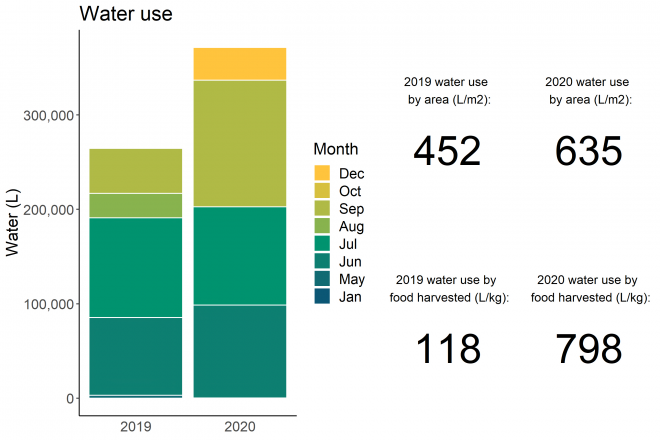
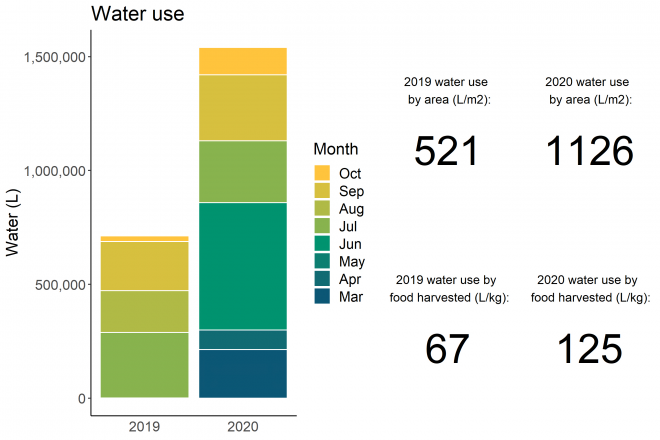
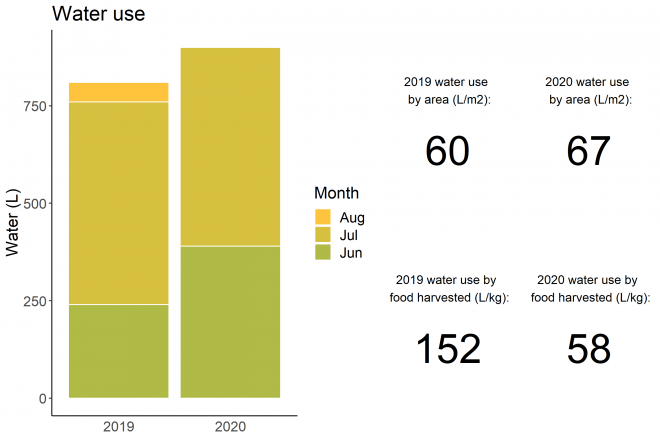
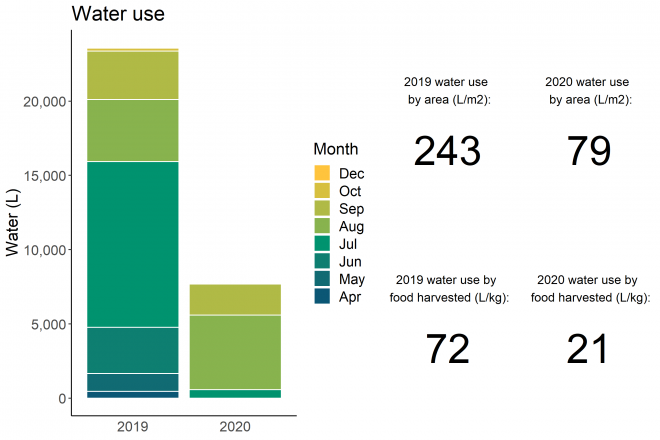
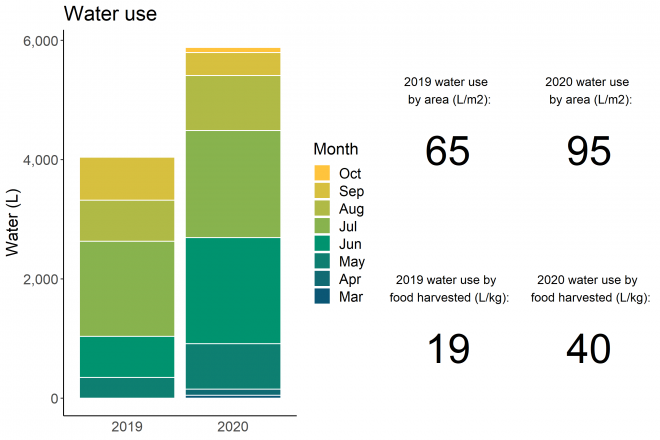
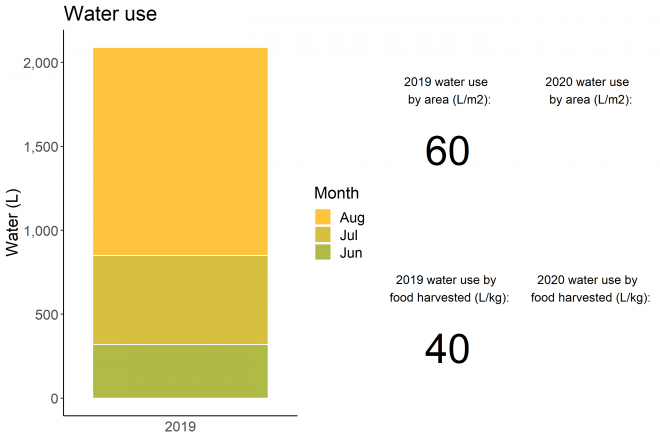
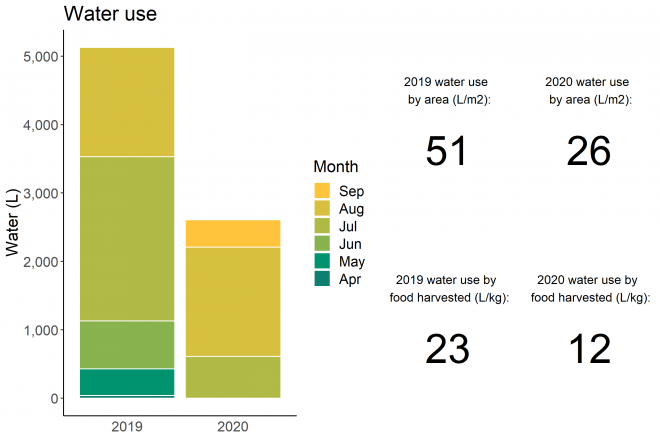
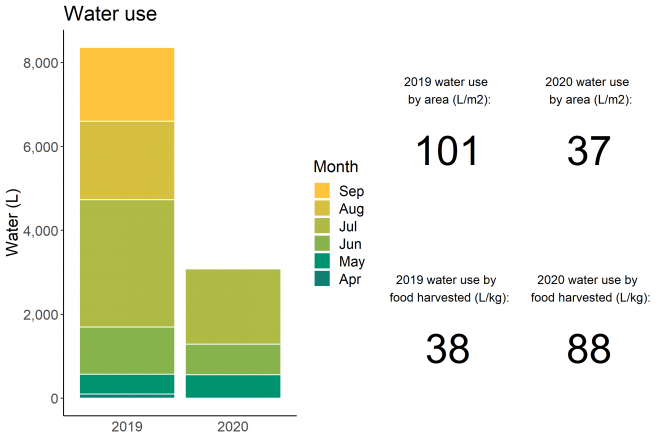
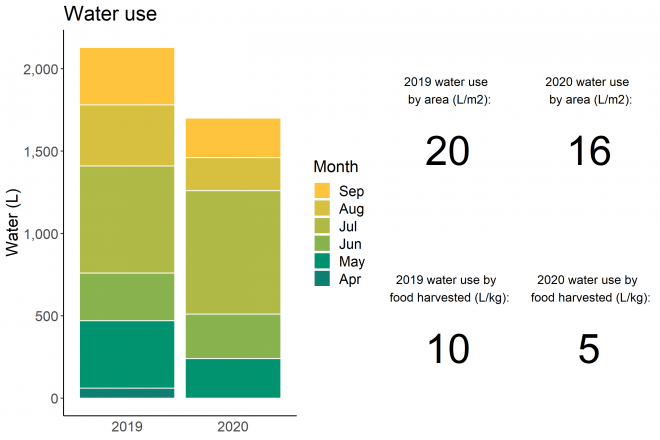
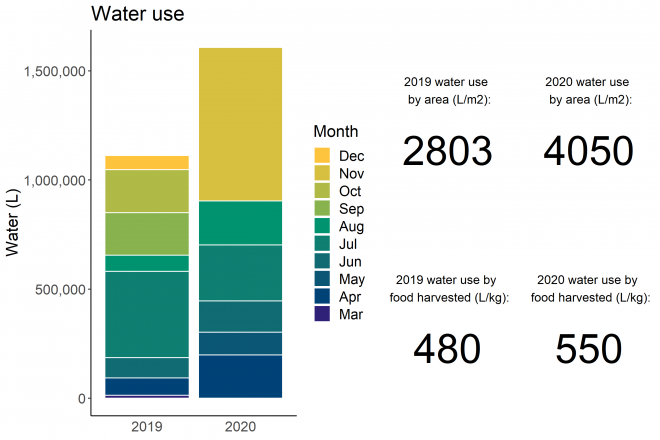
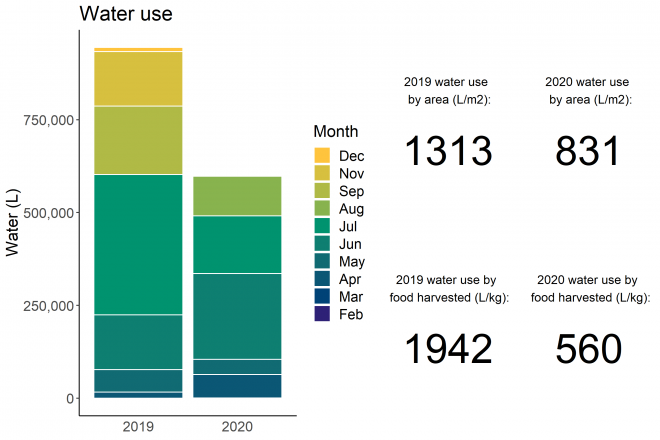
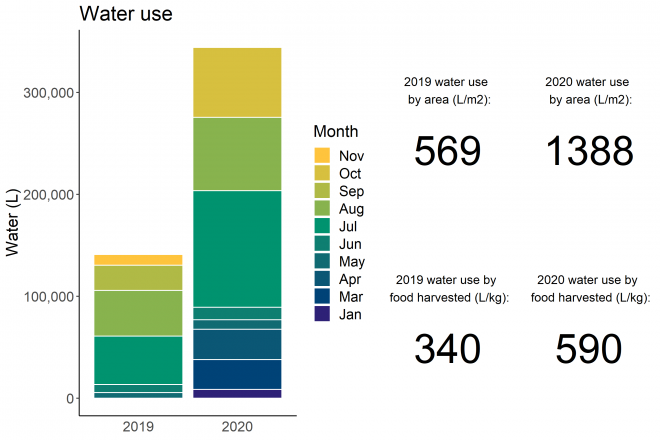
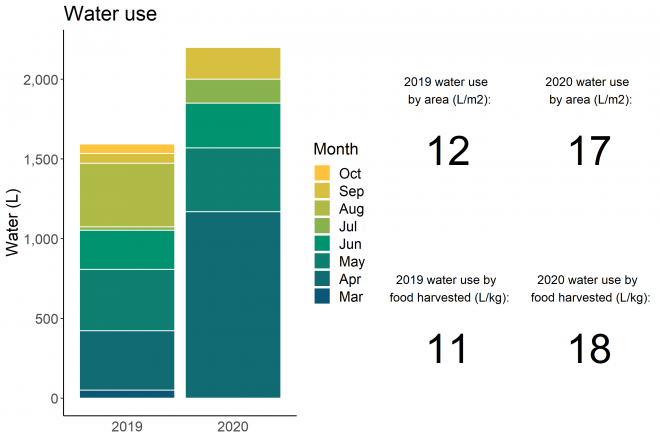
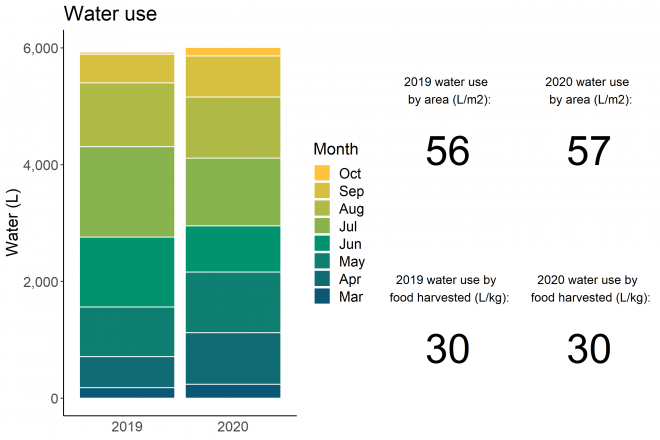
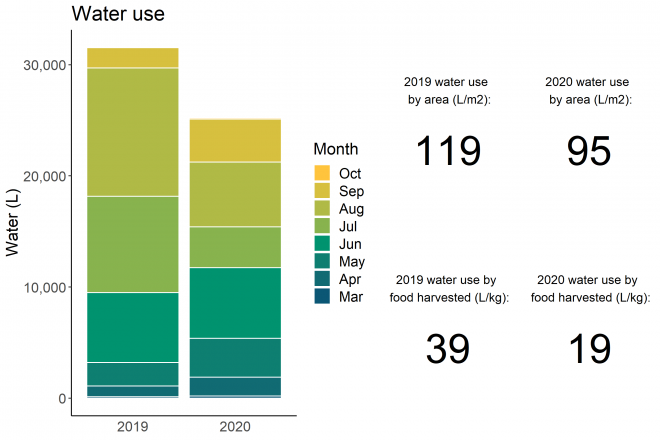
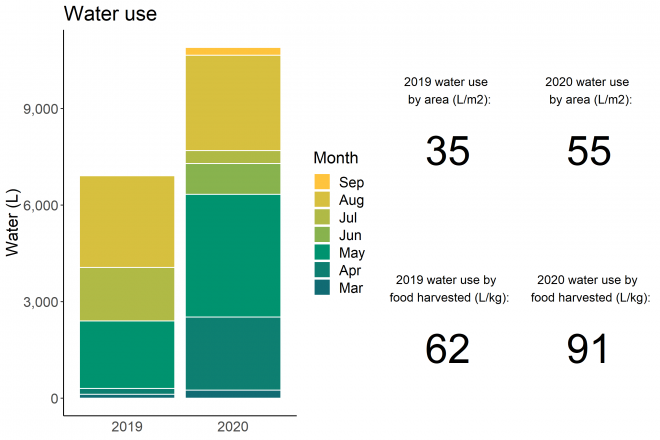
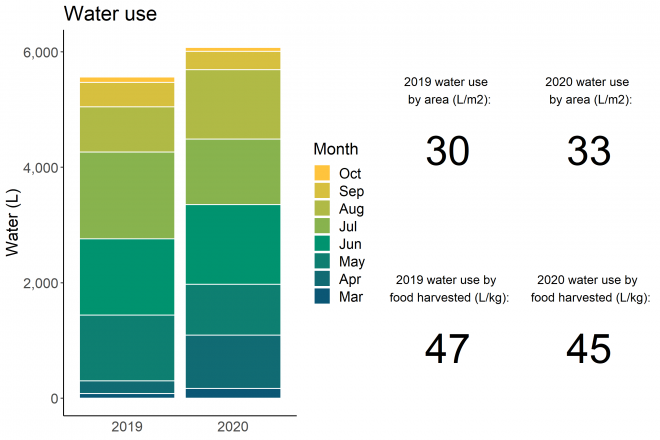
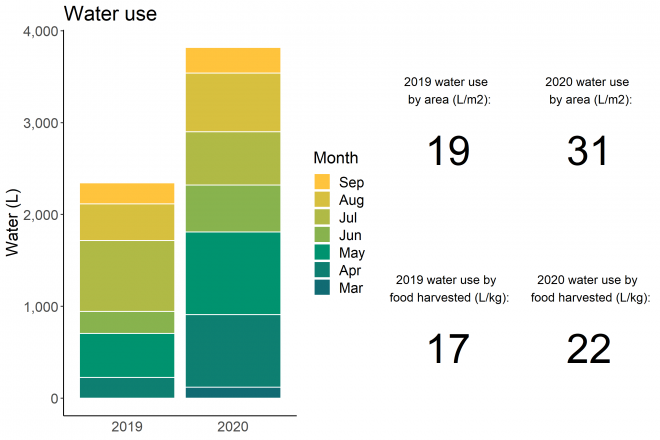
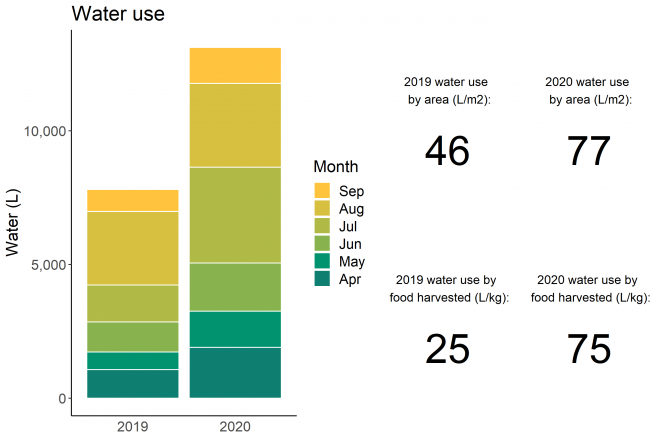
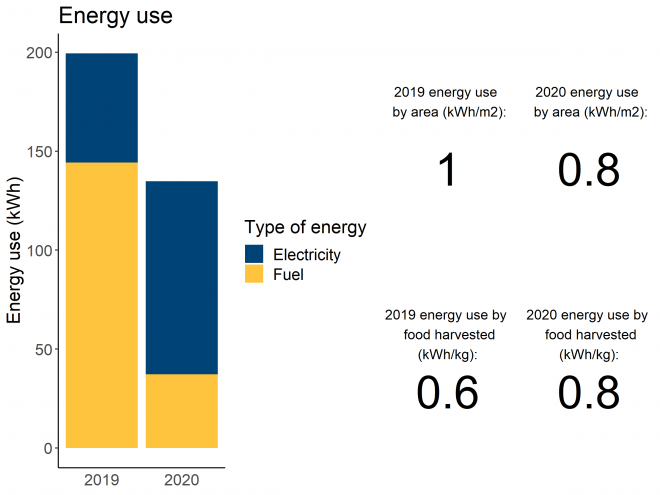
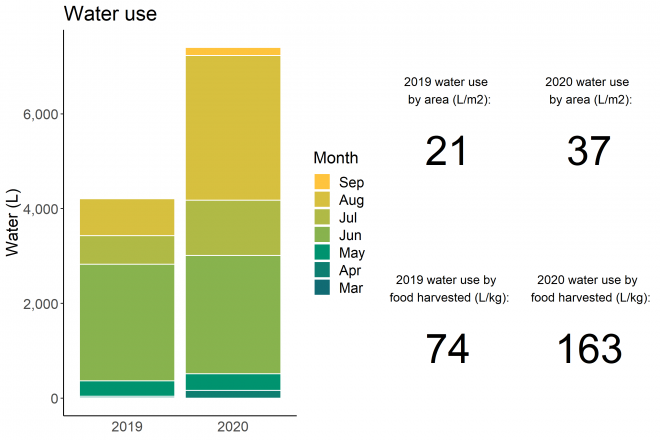
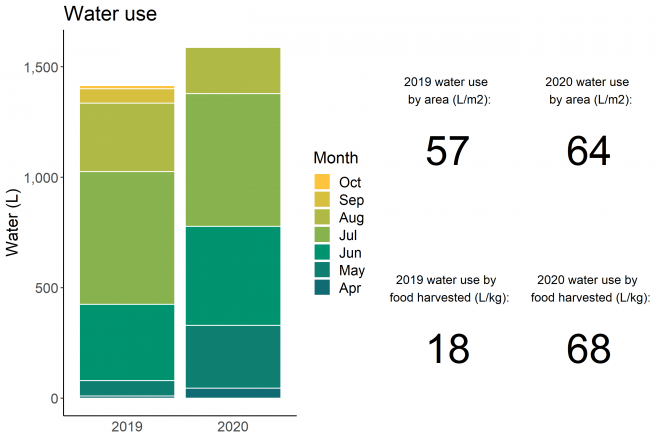
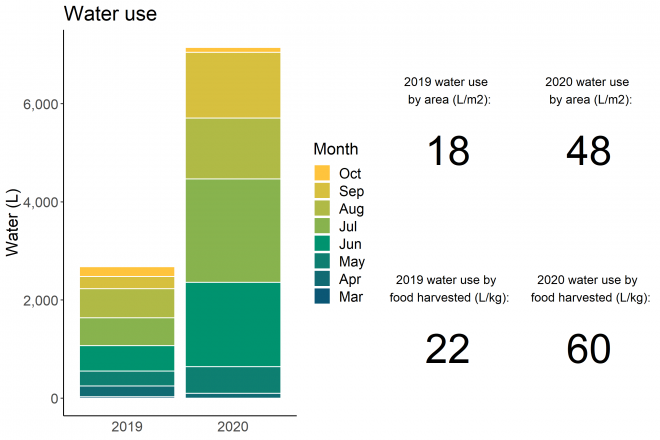
The water chart visualises in two bars the progressive consumption of water during 2019 and 2020, together with the consumption per meter squared of food production area and kilograms of food harvested. The scale on the vertical axis of each chart shows the overall consumption.
FOOD
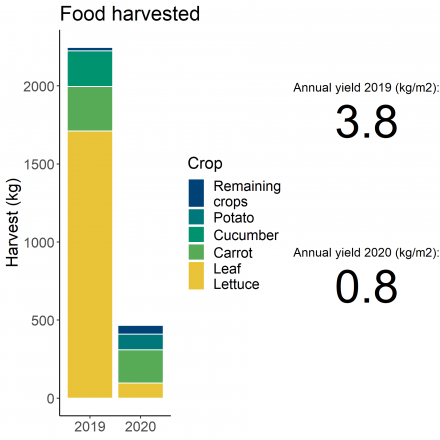
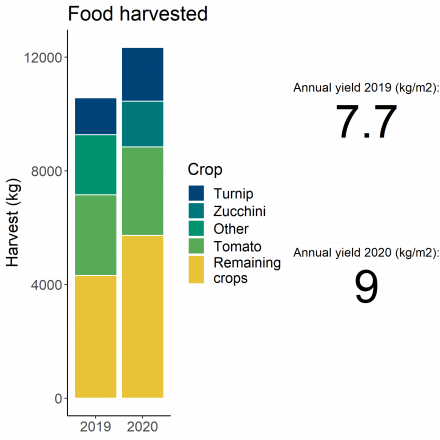
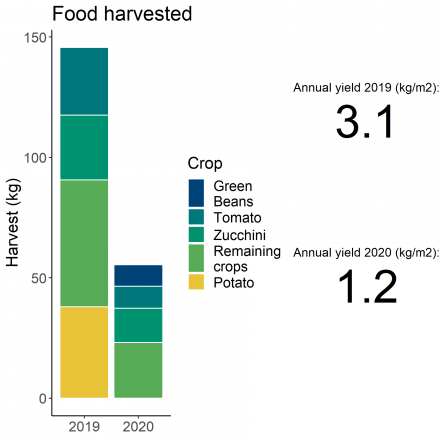
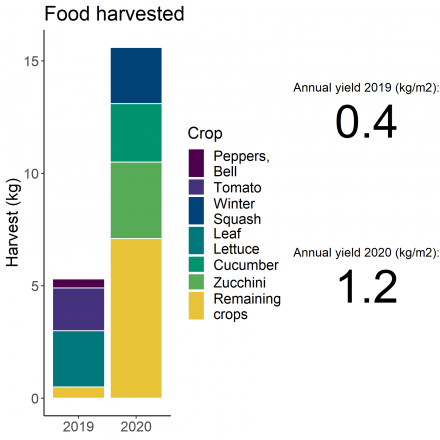
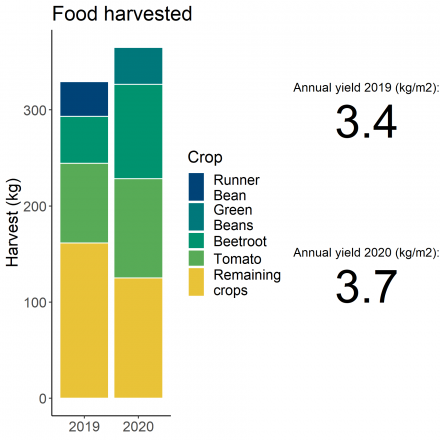
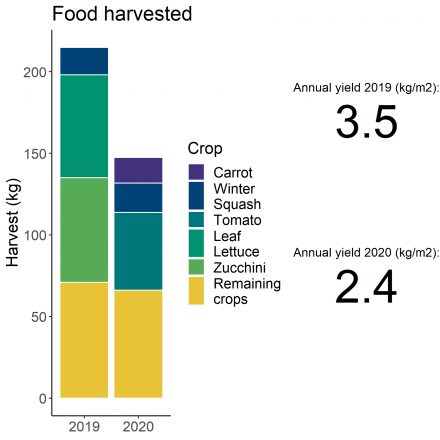
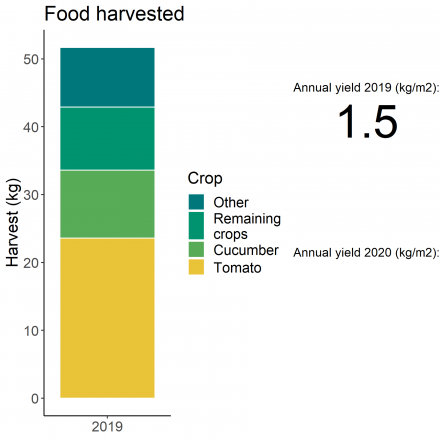
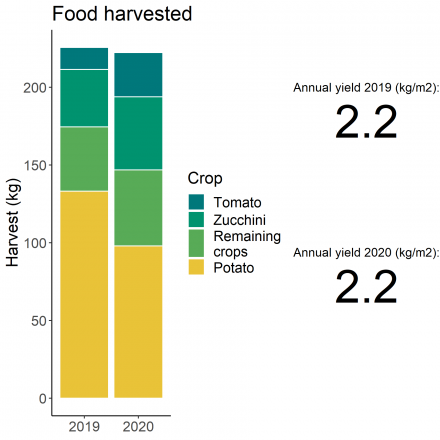
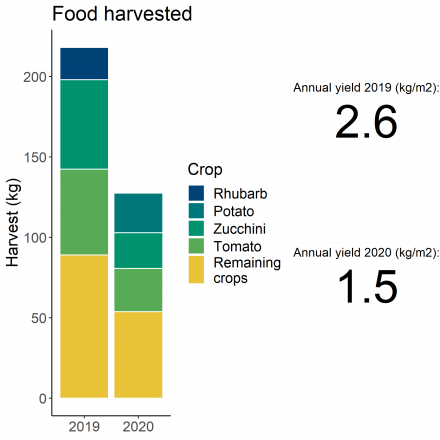
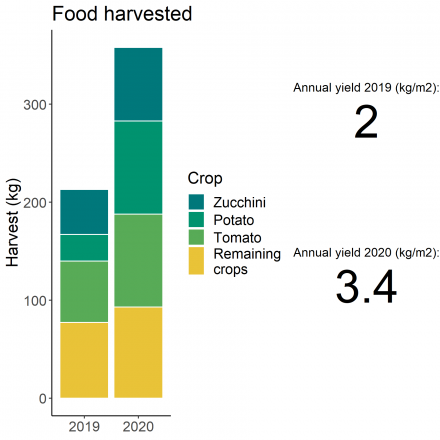
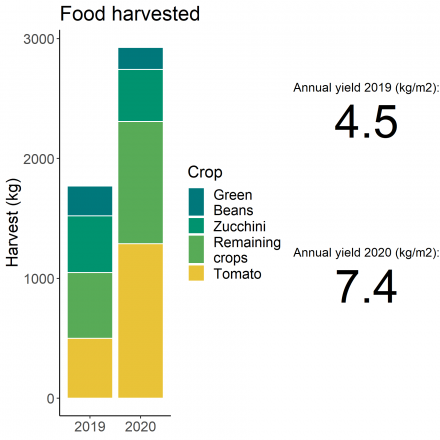
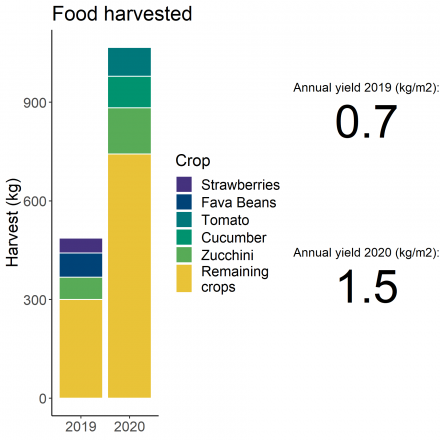
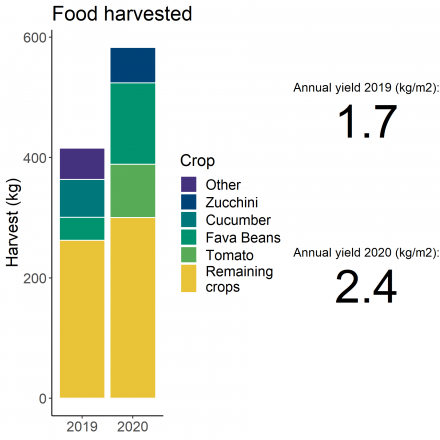
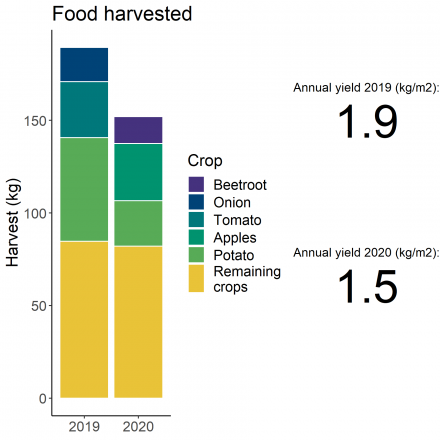
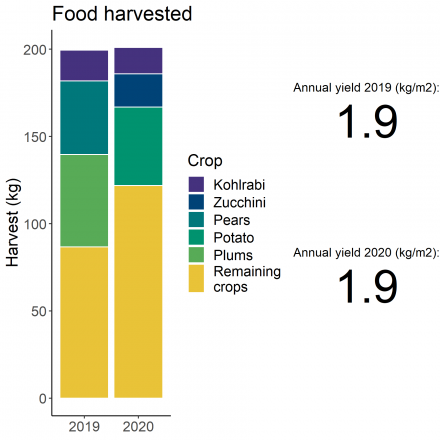
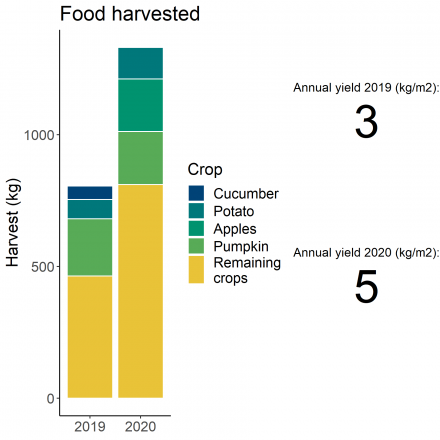
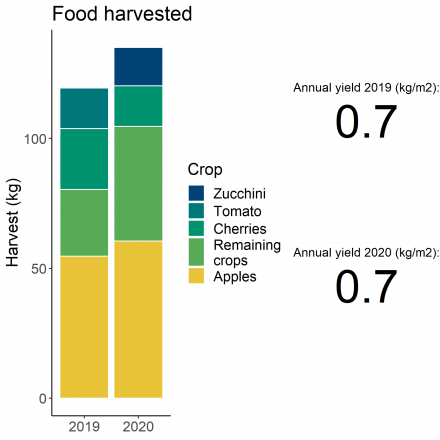
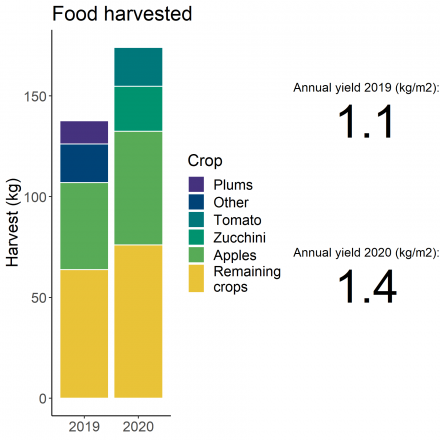
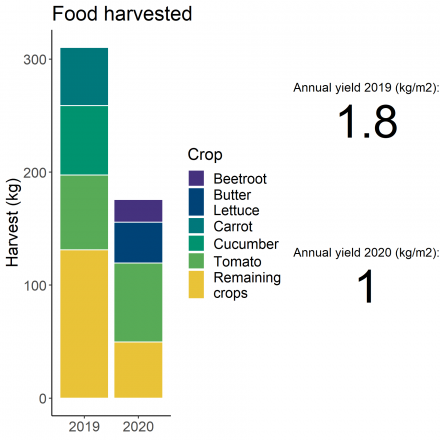
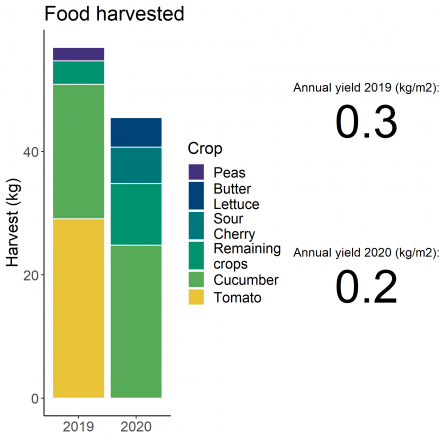
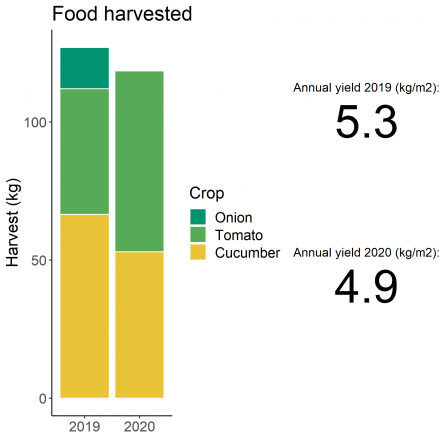
The harvest charts, rather than showing harvest per month, show the weight of the crops harvested together with the quantity of kilograms per m2 of food production area, which gives an indication of the intensity of production.
TRANSPORT
We have added a chart for trips to the garden, which in some cases generate a considerable consumption of fuel. This chart, however, needs to be interpreted. For example, in big cities such as New York or London, public transport is sometimes unavoidable and the number of kilometres may be also a consequence of the willingness of volunteers who do not live next to the garden to travel long distances. It may also indicate that a particular garden attracts many volunteers. This chart refers to trips in 2019.
![]()
IMPACTS AND MOTIVATIONS
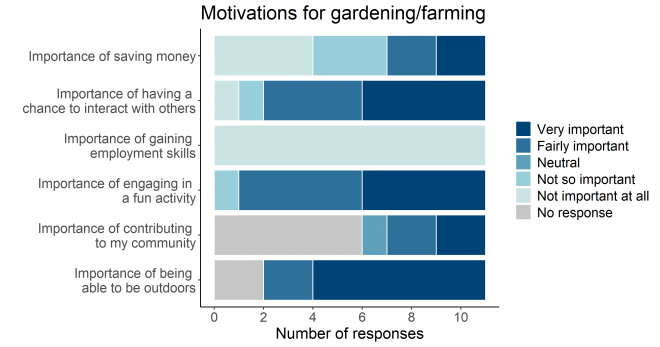
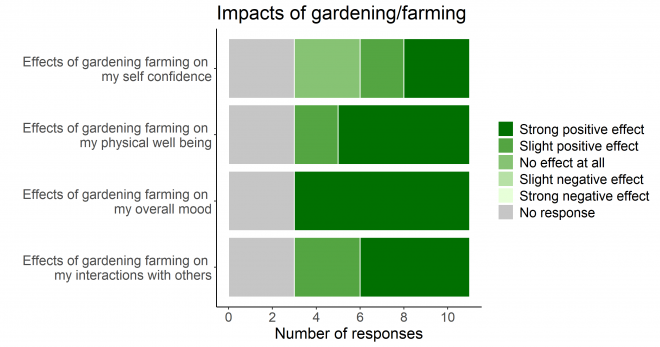
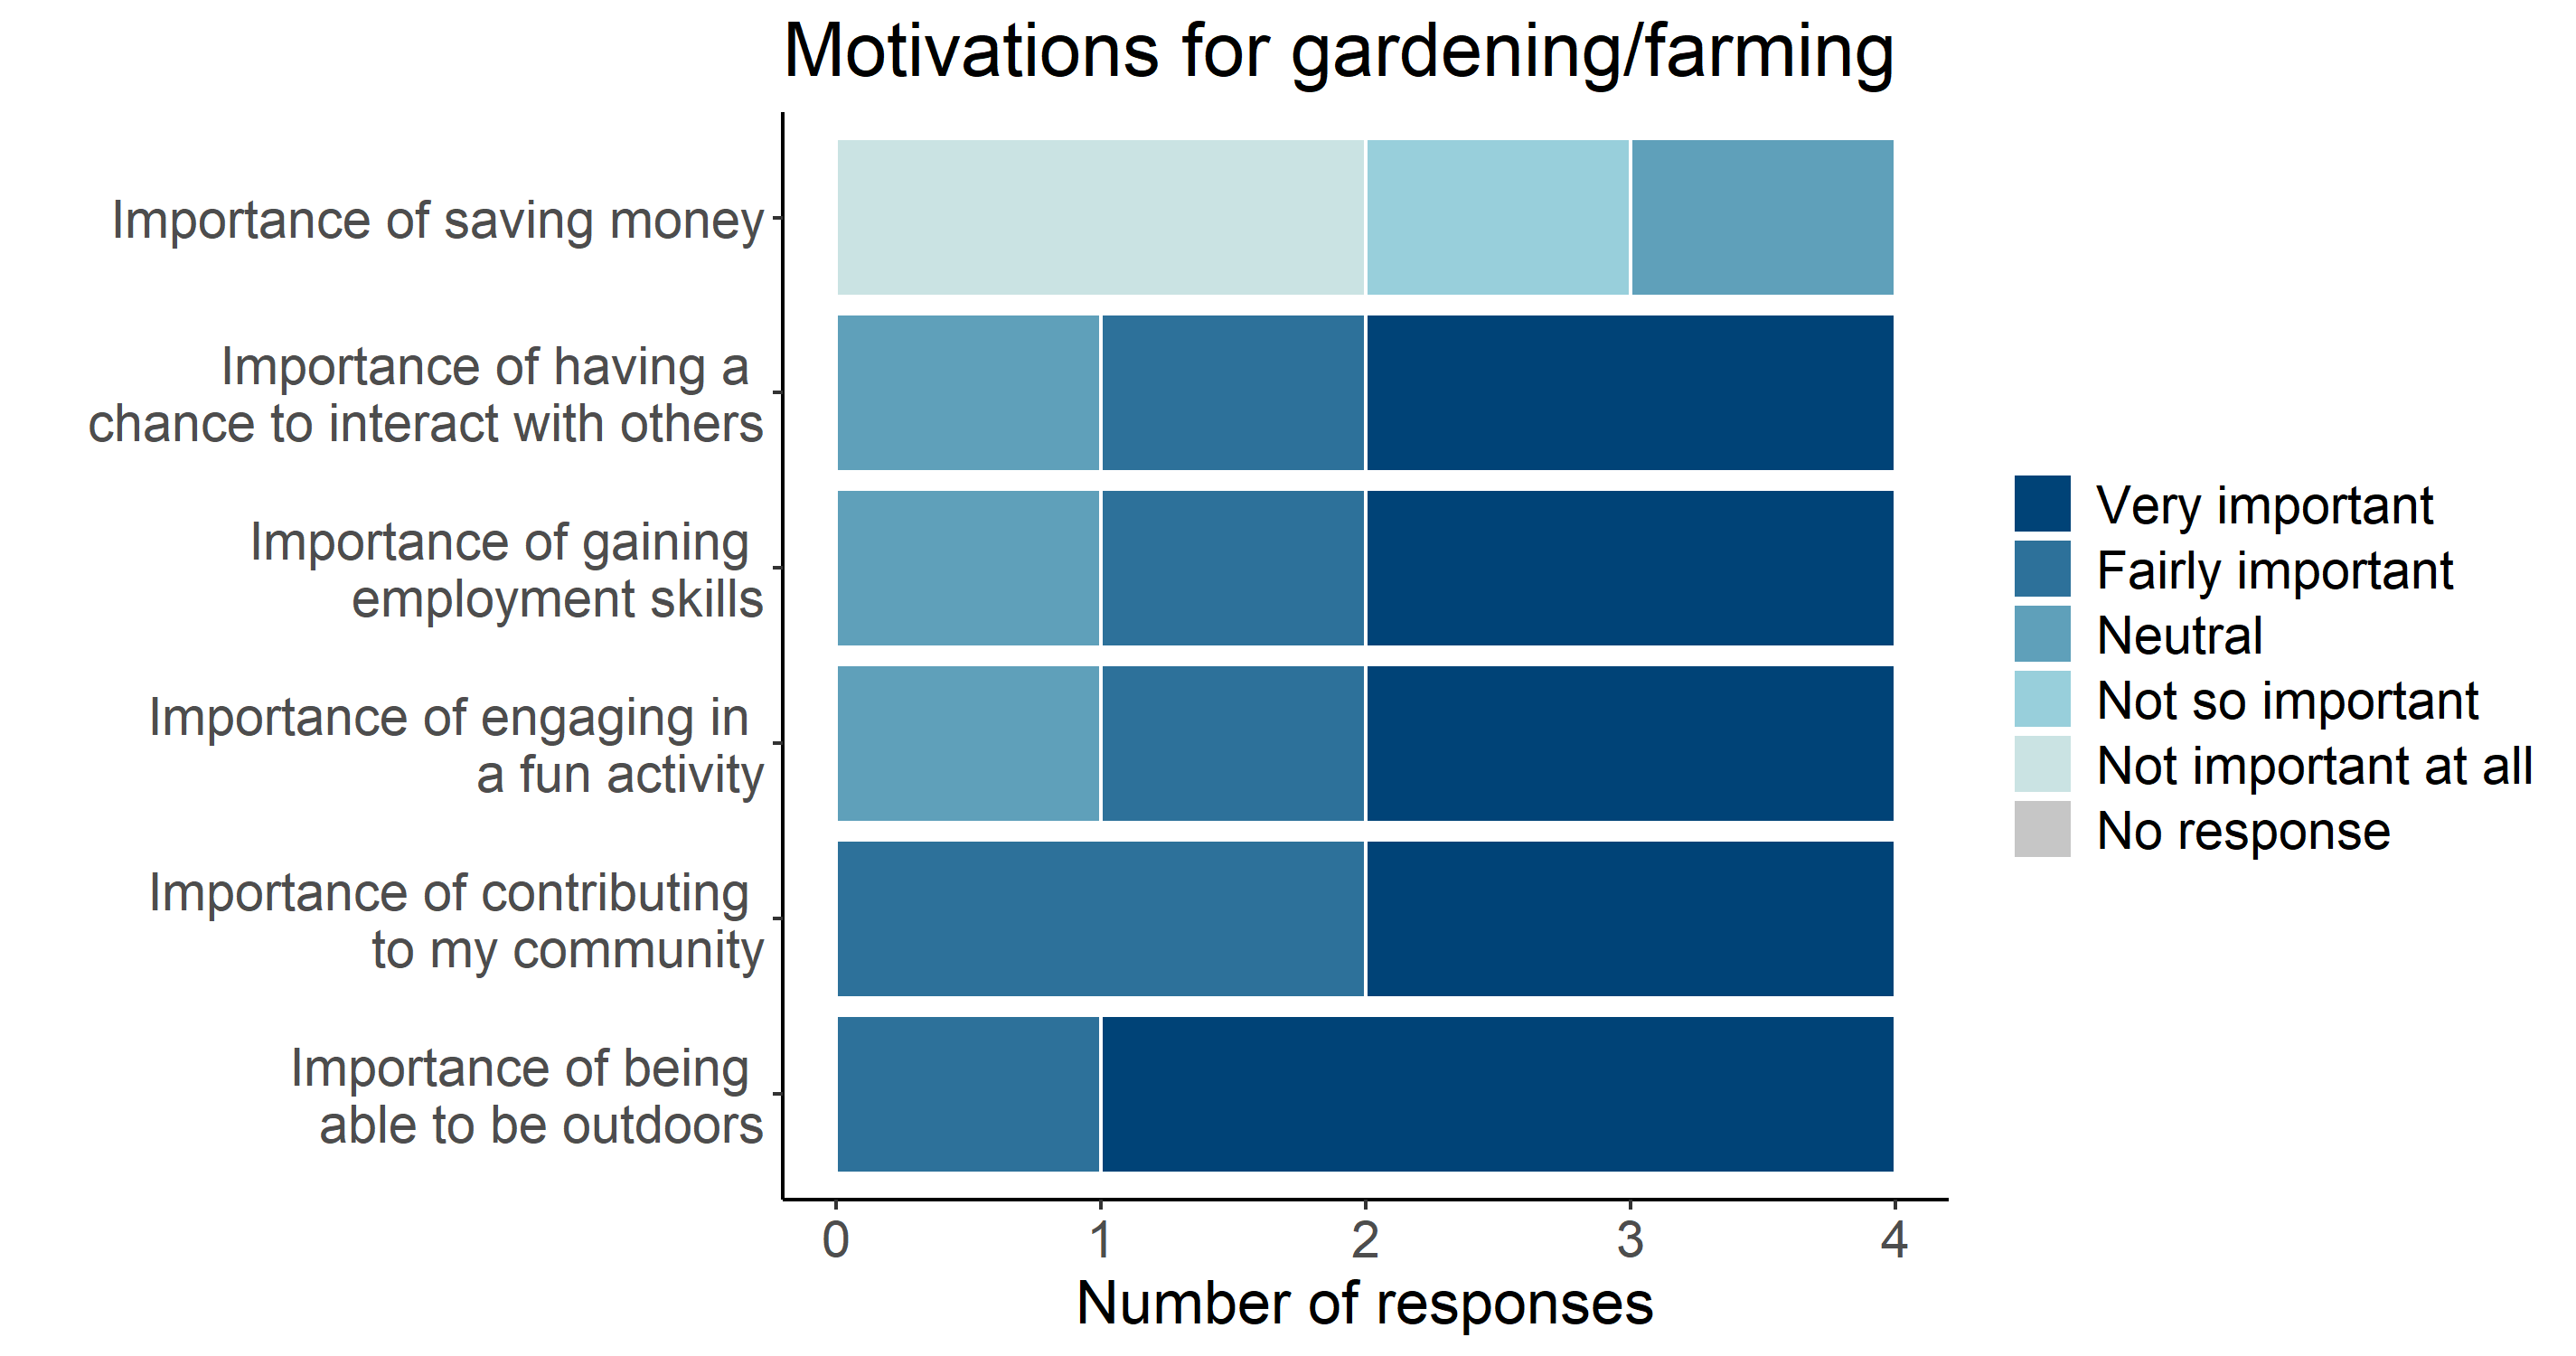
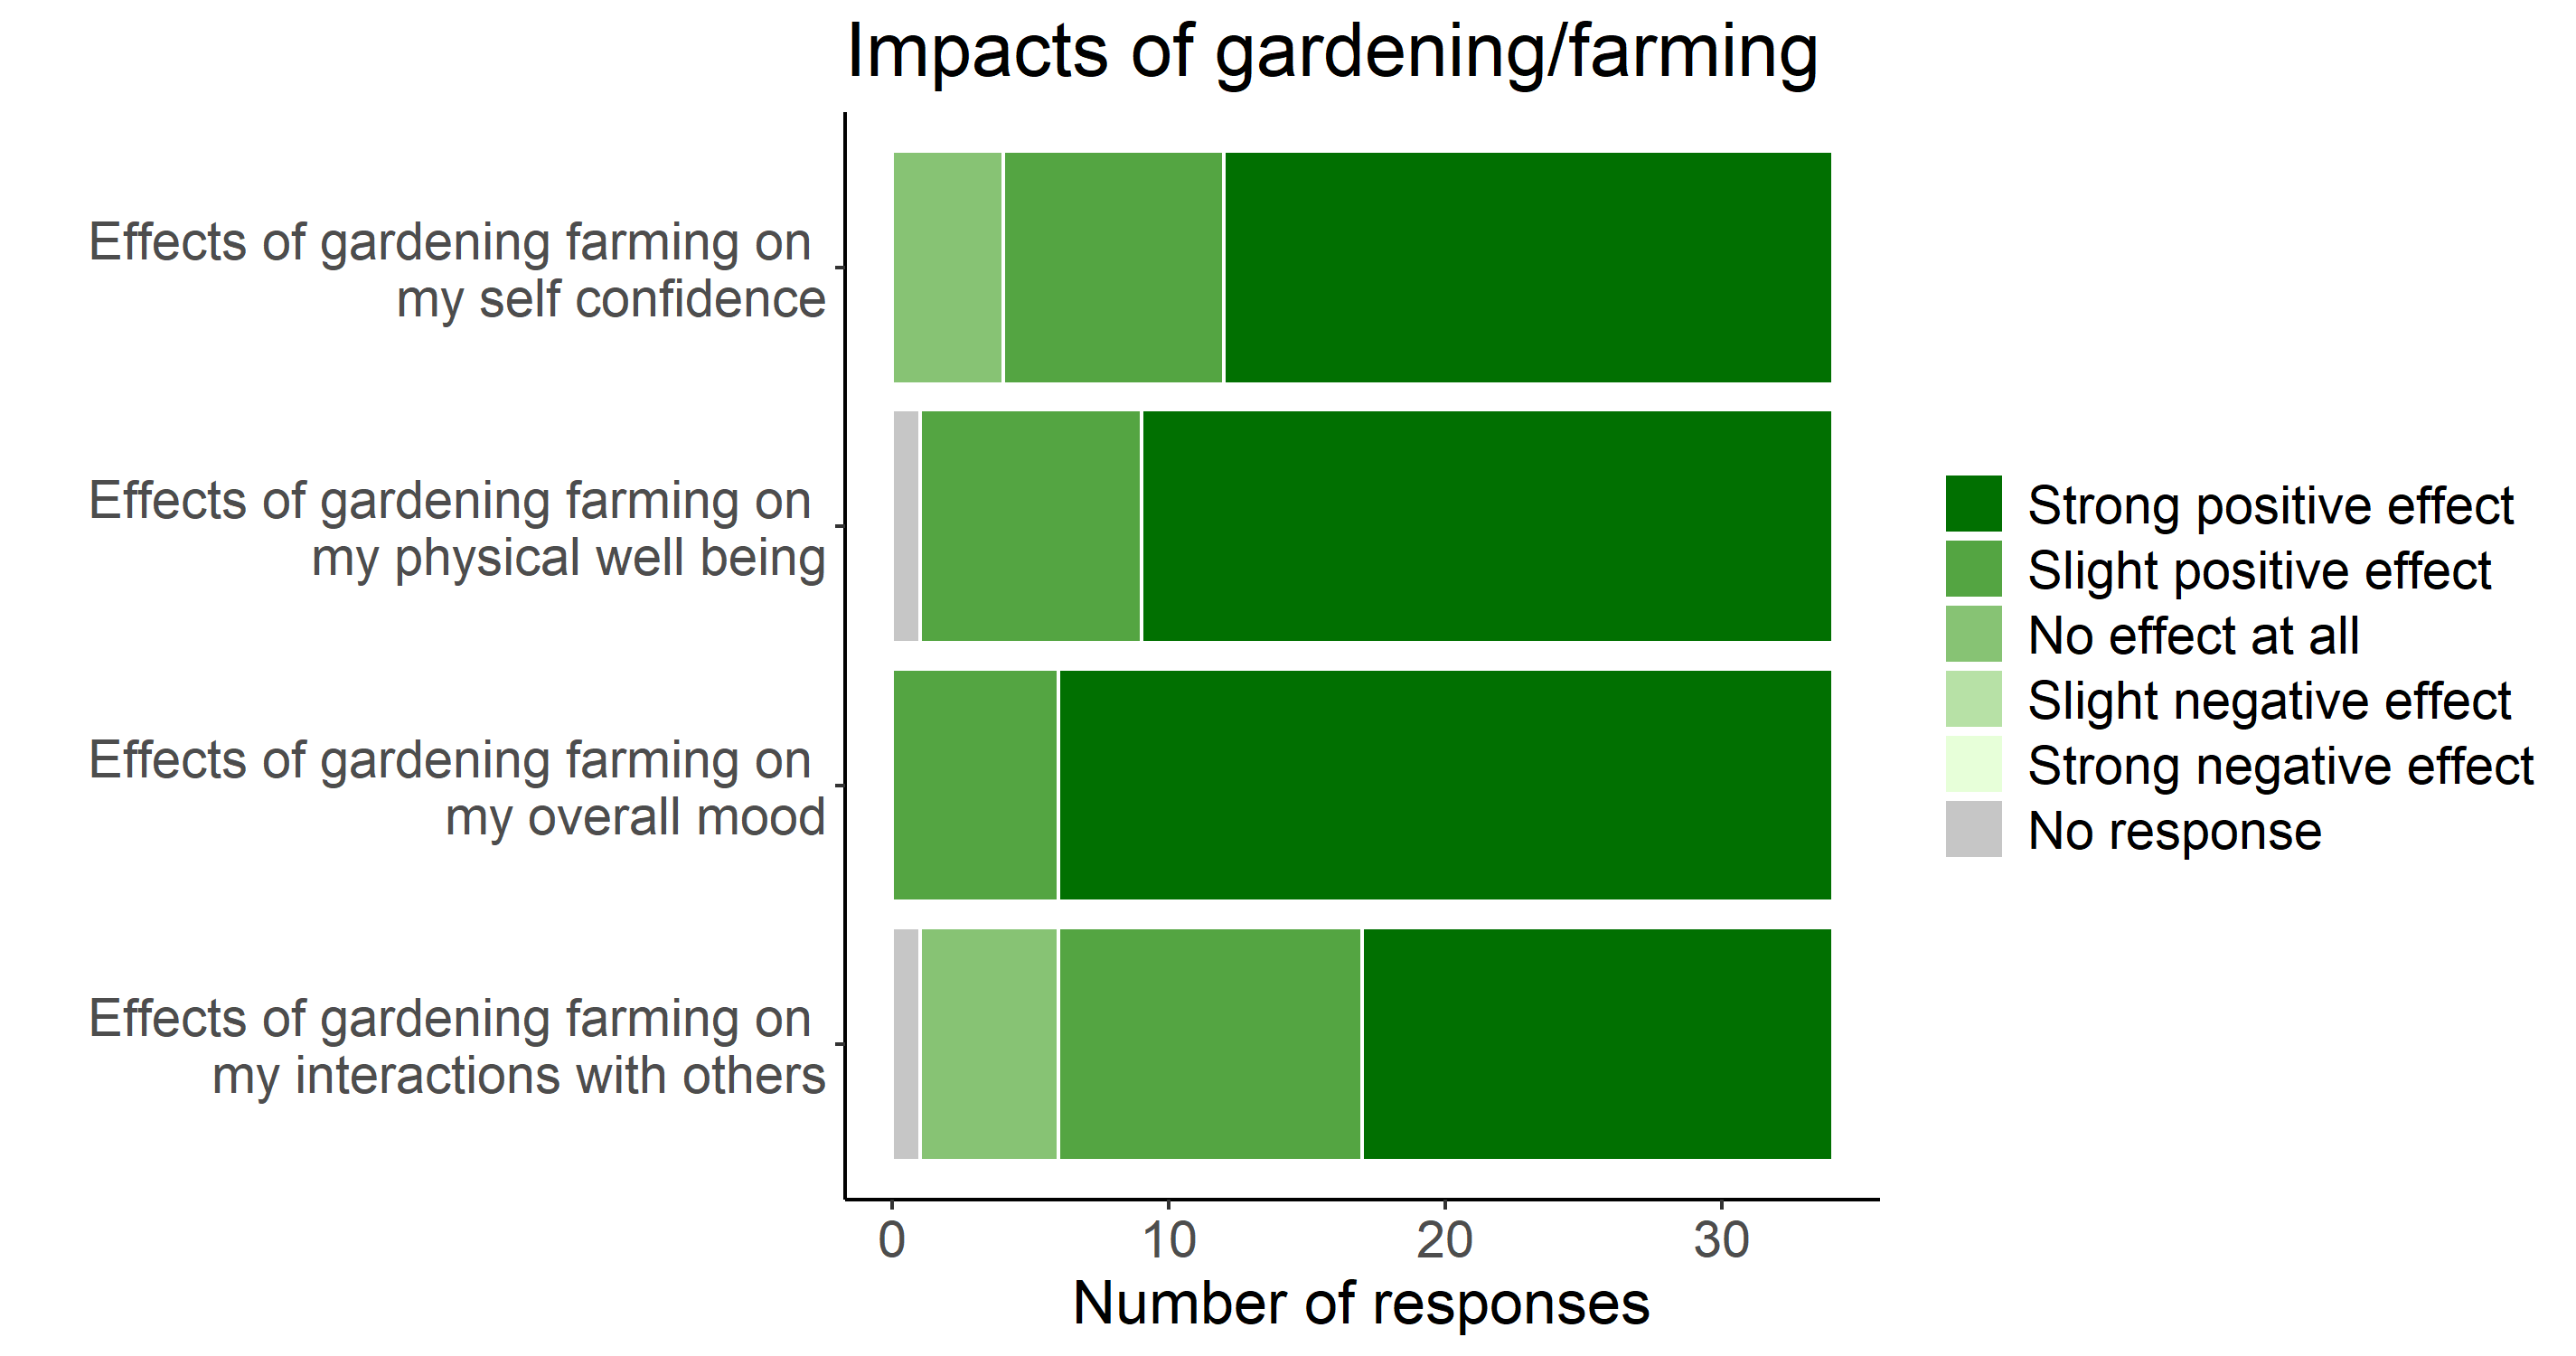
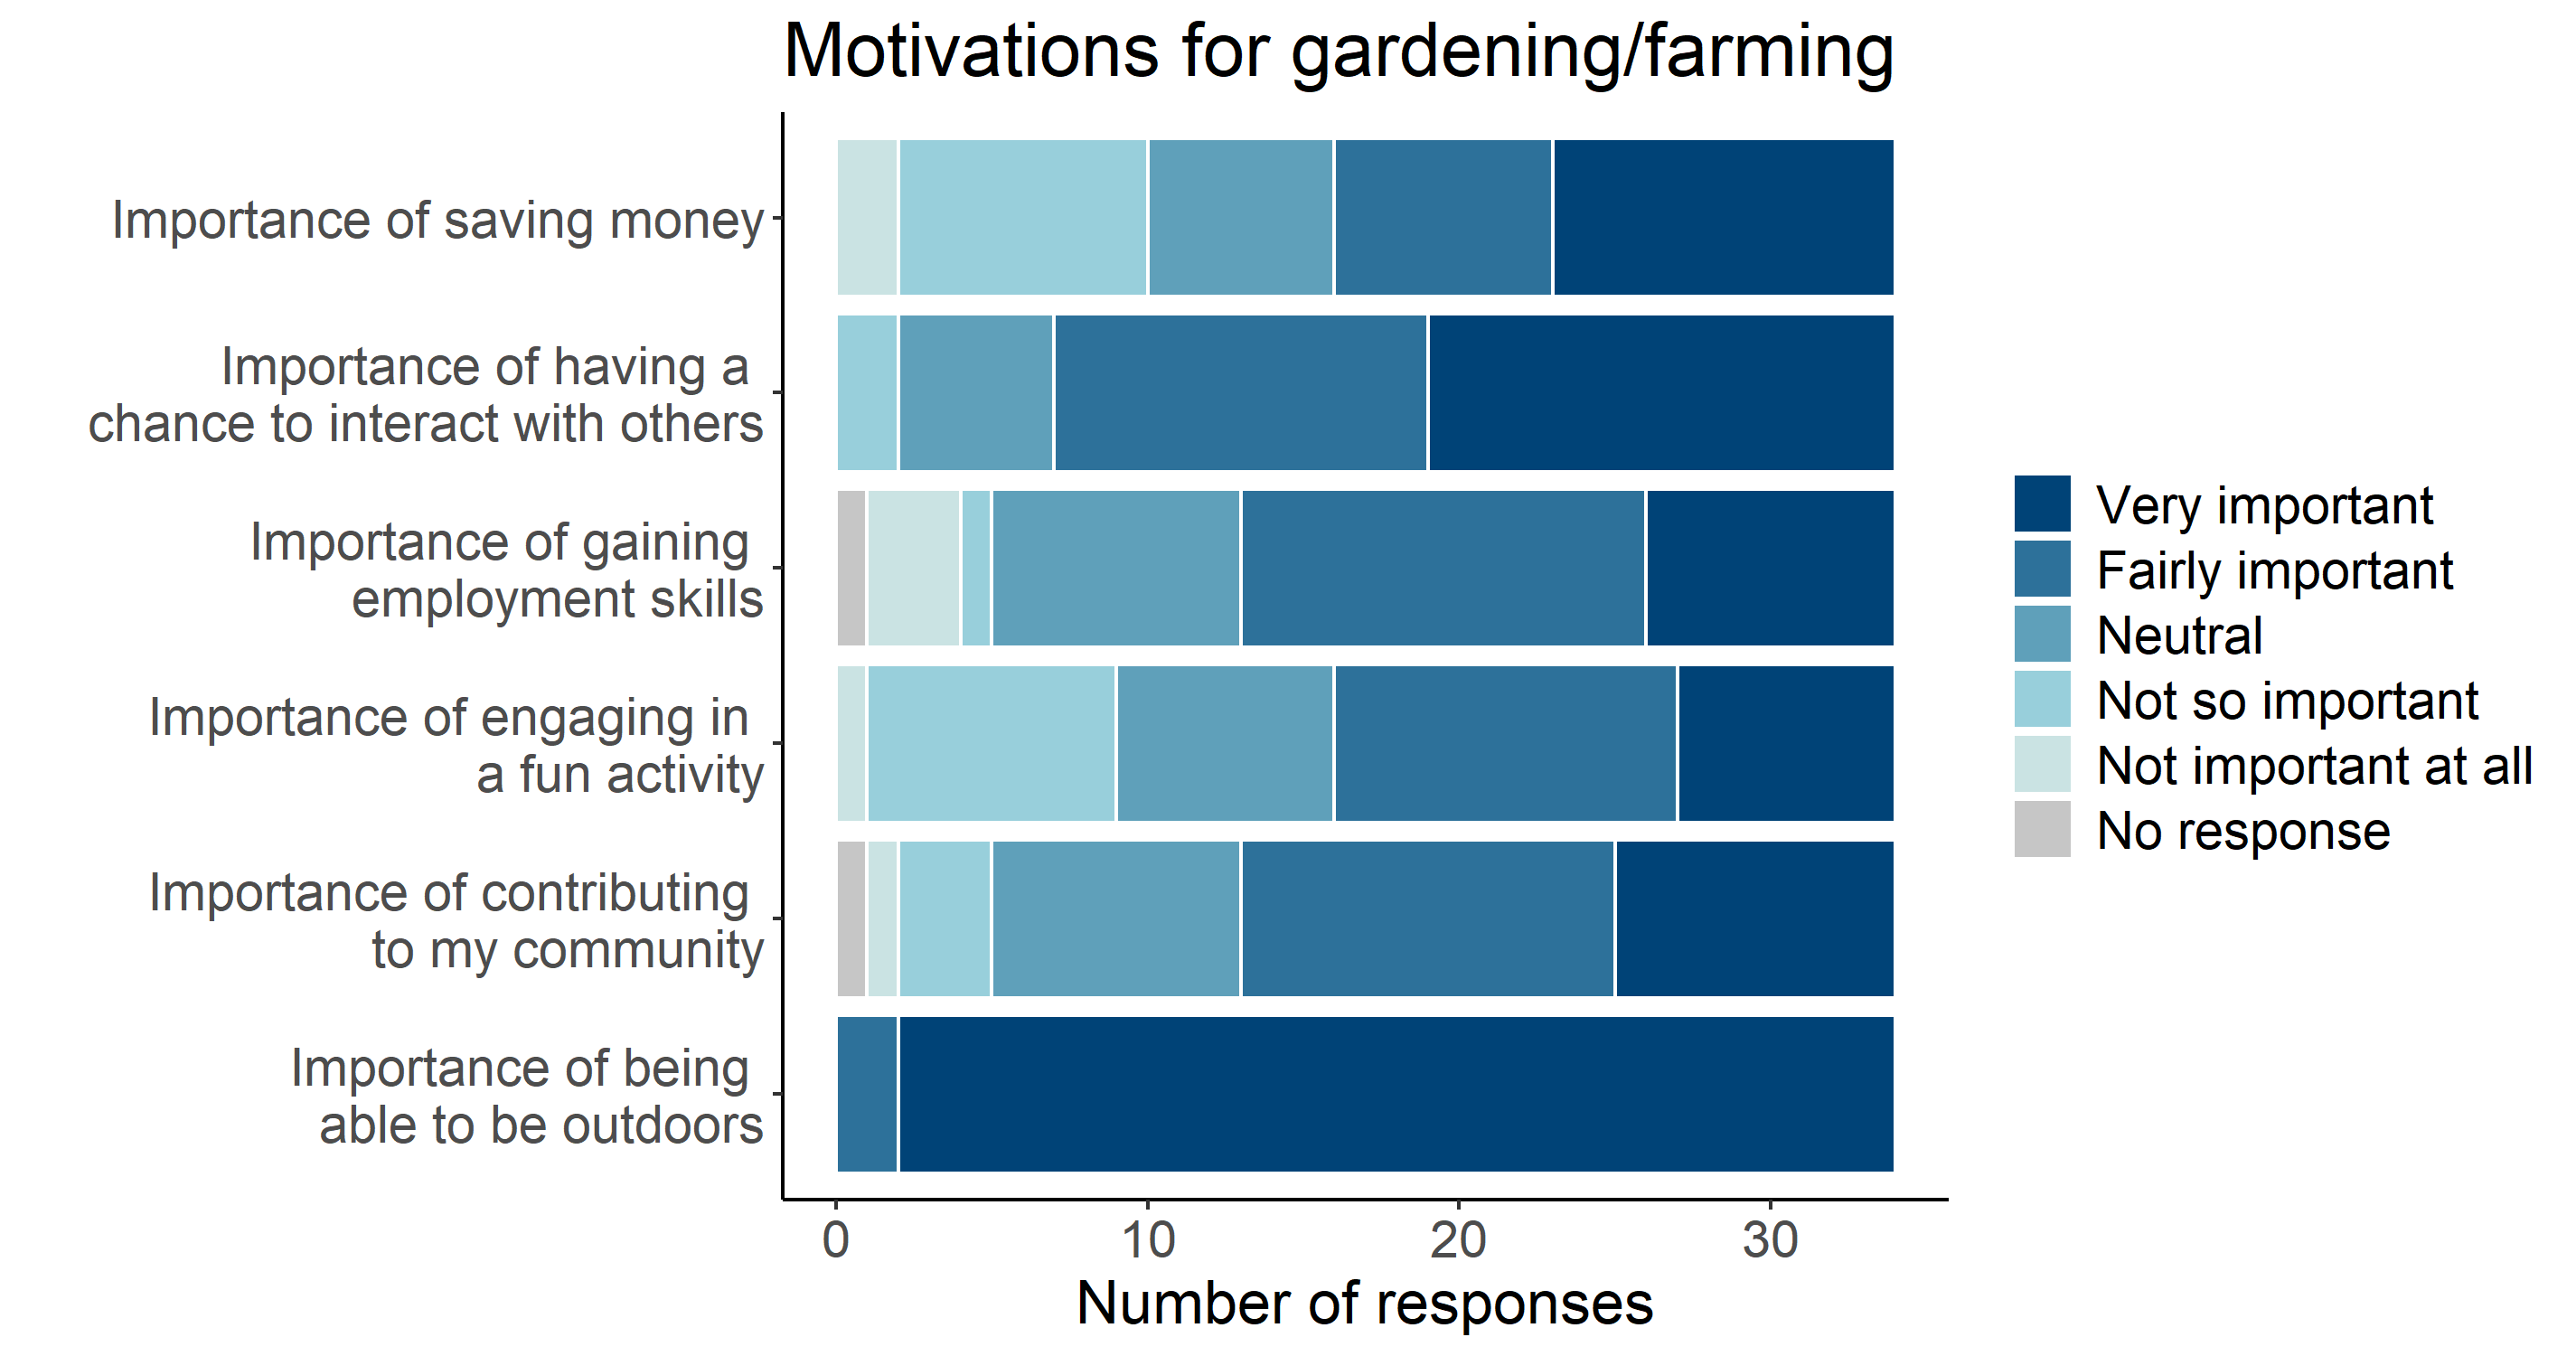
Finally, we have included two charts that show the motivations that most drive volunteers and gardeners to dedicate their time to grow food as well as the related impact on their wellbeing. This chart refers to impacts and motivations recorded in 2019.
DASHBOARD
The charts included in this ‘dashboard’ show resources that have been used to grow food on the area cultivated with edible crops and the quantity of food that has been grown over two years, during 2019 and 2020. The last two sections of this page are dedicated to transport and the perceived immaterial benefits accrued through gardening. We decided to include transport in these charts because the fuel that is sometimes used for transport adds to the resources used to grow food.
In the last section of the page, two charts show immaterial benefits in terms of motivations for our gardeners to work in this community garden and the impact that this work generates on their health, socialisation and more. Transport, motivations and impacts were identified on the basis of a survey amongst gardeners and volunteers conducted in 2019.
All charts are based on the data that gardeners have collected with much dedication.
WATER
The water chart visualises in two bars the progressive consumption of water during 2019 and 2020, together with the consumption per meter squared of food production area and kilograms of food harvested. The scale on the vertical axis of each chart shows the overall consumption.
FOOD
The harvest charts, rather than showing harvest per month, show the weight of the crops harvested together with the quantity of kilograms per m2 of food production area, which gives an indication of the intensity of production.
TRANSPORT
We have added a chart for trips to the garden, which in some cases generate a considerable consumption of fuel. This chart, however, needs to be interpreted. For example, in big cities such as New York or London, public transport is sometimes unavoidable and the number of kilometres may be also a consequence of the willingness of volunteers who do not live next to the garden to travel long distances. It may also indicate that a particular garden attracts many volunteers. This chart refers to trips in 2019.
![]()
IMPACTS AND MOTIVATIONS
Finally, we have included two charts that show the motivations that most drive volunteers and gardeners to dedicate their time to grow food as well as the related impact on their wellbeing. This chart refers to impacts and motivations recorded in 2019.

DASHBOARD
The charts included in this ‘dashboard’ show resources that have been used to grow food on the area cultivated with edible crops, the quantity of food that has been grown and the perceived immaterial benefits accrued through gardening, between March and the end of 2019. Charts are based on the data that gardeners have collected with much dedication.
WATER
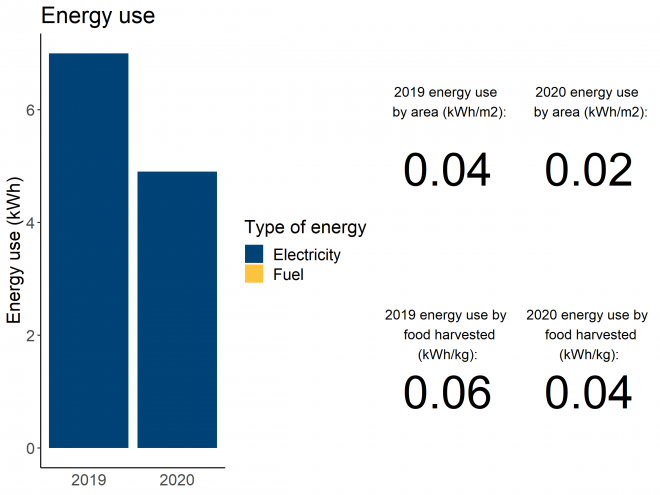
The water chart visualises in two bars the progressive consumption of water during 2019 and 2020, together with the consumption per meter squared of food production area and kilograms of food harvested. The scale on the vertical axis of each chart shows the overall consumption.
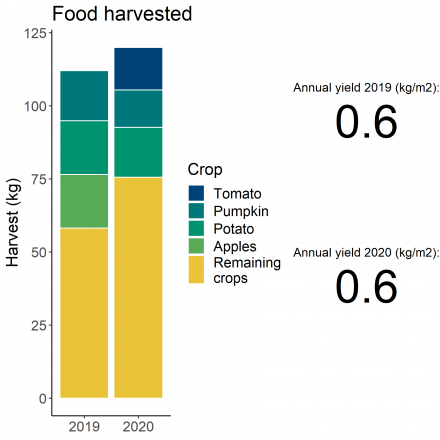
FOOD
The harvest charts, rather than showing harvest per month, show the weight of the crops harvested together with the quantity of kilograms per m2 of food production area, which gives an indication of the intensity of production.
TRANSPORT
We have added a chart for trips to the garden, which in some cases generate a considerable consumption of fuel. This chart, however, needs to be interpreted. For example, in big cities such as New York or London, public transport is sometimes unavoidable and the number of kilometres may be also a consequence of the willingness of volunteers who do not live next to the garden to travel long distances. It may also indicate that a particular garden attracts many volunteers. This chart refers to trips in 2019.
![]()
IMPACTS AND MOTIVATIONS
Finally, we have included two charts that show the motivations that most drive volunteers and gardeners to dedicate their time to grow food as well as the related impact on their wellbeing. This chart refers to impacts and motivations recorded in 2019.
DASHBOARD
The charts included in this ‘dashboard’ show resources that have been used to grow food on the area cultivated with edible crops and the quantity of food that has been grown over two years, during 2019 and 2020. The last two sections of this page are dedicated to transport and the perceived immaterial benefits accrued through gardening. We decided to include transport in these charts because the fuel that is sometimes used for transport adds to the resources used to grow food.
In the last section of the page, two charts show immaterial benefits in terms of motivations for our gardeners to work in this community garden and the impact that this work generates on their health, socialisation and more. Transport, motivations and impacts were identified on the basis of a survey amongst gardeners and volunteers conducted in 2019.
All charts are based on the data that gardeners have collected with much dedication.
WATER
The water chart visualises in two bars the progressive consumption of water during 2019 and 2020, together with the consumption per meter squared of food production area and kilograms of food harvested. The scale on the vertical axis of each chart shows the overall consumption.
FOOD
The harvest charts, rather than showing harvest per month, show the weight of the crops harvested together with the quantity of kilograms per m2 of food production area, which gives an indication of the intensity of production.
TRANSPORT
We have added a chart for trips to the garden, which in some cases generate a considerable consumption of fuel. This chart, however, needs to be interpreted. For example, in big cities such as New York or London, public transport is sometimes unavoidable and the number of kilometres may be also a consequence of the willingness of volunteers who do not live next to the garden to travel long distances. It may also indicate that a particular garden attracts many volunteers. This chart refers to trips in 2019.
![]()
IMPACTS AND MOTIVATIONS
Finally, we have included two charts that show the motivations that most drive volunteers and gardeners to dedicate their time to grow food as well as the related impact on their wellbeing. This chart refers to impacts and motivations recorded in 2019.

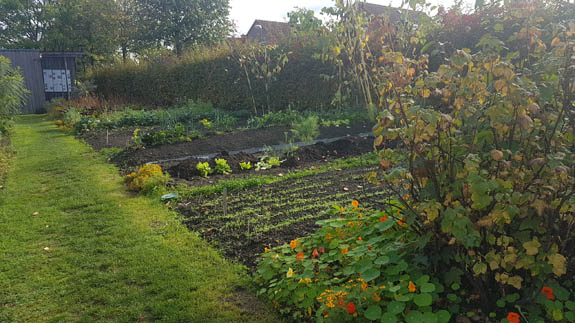
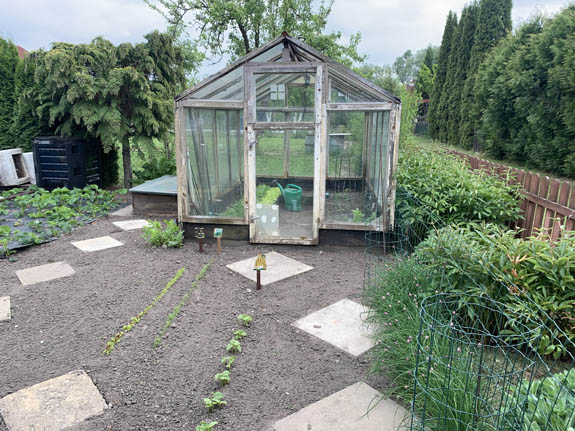
The case study plot has a total size of about 440m², of which 365m² are used for cultivation (lawns and flower beds included) and 130m² are used for producing vegetables and fruits. As a typical German allotment plot it includes a brick garden-house of 24m².
DASHBOARD
The charts included in this ‘dashboard’ show resources that have been used to grow food on the area cultivated with edible crops, the quantity of food that has been grown and the perceived immaterial benefits accrued through gardening, between March and the end of October 2019. Charts are based on the data that gardeners have collected with much dedication.
WATER
The water chart visualises in a bar the progressive consumption of water and electricity across some months of the year, together with the consumption per meter squared of food production area and kilogram of food harvested. The scale on the vertical axis of each chart shows the overall consumption.
FOOD
The harvest chart, rather than showing harvest per month, shows the weight of the crops that were picked together with the quantity of kilograms per meter squared of food production area, which gives an indication of the intensity of production.
TRANSPORT
We have added a chart for trips to the garden, which in some cases generate a considerable consumption of fuel. This chart, however, needs to be interpreted. For example, in big cities such as New York or London, public transport is sometimes unavoidable and the quantity of kilometres may be also a consequence of the willingness of volunteers who do not live next to the garden to travel long distances. It may also indicate that a particular garden attracts many volunteers.
![]()
IMPACTS AND MOTIVATIONS
Finally, we have included two charts that show the motivations that most drive volunteers and gardeners to dedicate their time to grow food as well as the related impact on their wellbeing. The charts refer to answers given by all German case study participants and not to one single allotment plot holder.
The case study plot has a total size of about 860 m², consisting to two regular allotment plots, of which about 760 m² are used for mixed cultivation (flower beds, vegetables and fruits). As a result of the merging of two garden plots, there are two buildings: a wooden gazebo and the former brick garden house, which is only used as a tool shed.
DASHBOARD
The charts included in this ‘dashboard’ show resources that have been used to grow food on the area cultivated with edible crops, the quantity of food that has been grown and the perceived immaterial benefits accrued through gardening, between March and the end of October 2019. Charts are based on the data that gardeners have collected with much dedication.
WATER
The water chart visualises in a bar the progressive consumption of water and electricity across some months of the year, together with the consumption per meter squared of food production area and kilogram of food harvested. The scale on the vertical axis of each chart shows the overall consumption.


FOOD
The harvest chart, rather than showing harvest per month, shows the weight of the crops that were picked together with the quantity of kilograms per meter squared of food production area, which gives an indication of the intensity of production.

TRANSPORT
We have added a chart for trips to the garden, which in some cases generate a considerable consumption of fuel. This chart, however, needs to be interpreted. For example, in big cities such as New York or London, public transport is sometimes unavoidable and the quantity of kilometres may be also a consequence of the willingness of volunteers who do not live next to the garden to travel long distances. It may also indicate that a particular garden attracts many volunteers.
![]()
IMPACTS AND MOTIVATIONS
Finally, we have included two charts that show the motivations that most drive volunteers and gardeners to dedicate their time to grow food as well as the related impact on their wellbeing. The charts refer to answers given by all German case study participants and not to one single allotment plot holder.
DASHBOARD
The charts included in this ‘dashboard’ show resources that have been used to grow food on the area cultivated with edible crops, the quantity of food that has been grown and the perceived immaterial benefits accrued through gardening, between March and the end of October 2019. Charts are based on the data that gardeners have collected with much dedication.
WATER
The water chart visualises in a bar the progressive consumption of water and electricity across some months of the year, together with the consumption per meter squared of food production area and kilogram of food harvested. The scale on the vertical axis of each chart shows the overall consumption.
FOOD
The harvest chart, rather than showing harvest per month, shows the weight of the crops that were picked together with the quantity of kilograms per meter squared of food production area, which gives an indication of the intensity of production.
TRANSPORT
We have added a chart for trips to the garden, which in some cases generate a considerable consumption of fuel. This chart, however, needs to be interpreted. For example, in big cities such as New York or London, public transport is sometimes unavoidable and the quantity of kilometres may be also a consequence of the willingness of volunteers who do not live next to the garden to travel long distances. It may also indicate that a particular garden attracts many volunteers.
![]()
IMPACTS AND MOTIVATIONS
Finally, we have included two charts that show the motivations that most drive volunteers and gardeners to dedicate their time to grow food as well as the related impact on their wellbeing. The charts refer to answers given by all German case study participants and not to one single allotment plot holder.
The case study garden consists of the southern parts of the teaching garden with a size of about 850 m², of which 768 m² are used for cultivation (flower beds, lawn, vegetables and fruit). On 270 m² vegetables and fruits are produced. Besides two wooden houses that offer space for storing garden tools and a house for bee-keeping the greenhouse in the northern part of the garden also is included in the case study.
DASHBOARD
The charts included in this ‘dashboard’ show resources that have been used to grow food on the area cultivated with edible crops, the quantity of food that has been grown and the perceived immaterial benefits accrued through gardening, between March and the end of October 2019. Charts are based on the data that gardeners have collected with much dedication.
WATER
The water chart visualises in a bar the progressive consumption of water across some months of the year, together with the consumption per meter squared of food production area and kilogram of food harvested. The scale on the vertical axis of each chart shows the overall consumption. This garden is maintained without using electric or other energy.
FOOD
The harvest chart, rather than showing harvest per month, shows the weight of the crops that were picked together with the quantity of kilograms per meter squared of food production area, which gives an indication of the intensity of production.
TRANSPORT
We have added a chart for trips to the garden, which in some cases generate a considerable consumption of fuel. This chart, however, needs to be interpreted. For example, in big cities such as New York or London, public transport is sometimes unavoidable and the quantity of kilometres may be also a consequence of the willingness of volunteers who do not live next to the garden to travel long distances. It may also indicate that a particular garden attracts many volunteers.
![]()
IMPACTS AND MOTIVATIONS
Finally, we have included two charts that show the motivations that most drive volunteers and gardeners to dedicate their time to grow food as well as the related impact on their wellbeing. The charts refer to answers given by all German case study participants and not to one single allotment plot holder.
DASHBOARD
The charts included in this ‘dashboard’ show resources that have been used to grow food on the area cultivated with edible crops, the quantity of food that has been grown and the perceived immaterial benefits accrued through gardening, between March and the end of October 2019. Charts are based on the data that gardeners have collected with much dedication.
WATER
The water chart visualises in a bar the progressive consumption of water and electricity across some months of the year, together with the consumption per meter squared of food production area and kilogram of food harvested. The scale on the vertical axis of each chart shows the overall consumption.


FOOD
The harvest chart, rather than showing harvest per month, shows the weight of the crops that were picked together with the quantity of kilograms per meter squared of food production area, which gives an indication of the intensity of production.

TRANSPORT
We have added a chart for trips to the garden, which in some cases generate a considerable consumption of fuel. This chart, however, needs to be interpreted. For example, in big cities such as New York or London, public transport is sometimes unavoidable and the quantity of kilometres may be also a consequence of the willingness of volunteers who do not live next to the garden to travel long distances. It may also indicate that a particular garden attracts many volunteers.
![]()
IMPACTS AND MOTIVATIONS
Finally, we have included two charts that show the motivations that most drive volunteers and gardeners to dedicate their time to grow food as well as the related impact on their wellbeing. The charts refer to answers given by all German case study participants and not to one single allotment plot holder.
DASHBOARD
The charts included in this ‘dashboard’ show resources that have been used to grow food on the area cultivated with edible crops, the quantity of food that has been grown and the perceived immaterial benefits accrued through gardening, between March and the end of October 2019. Charts are based on the data that gardeners have collected with much dedication.
WATER
The water chart visualises in a bar the progressive consumption of water and electricity across some months of the year, together with the consumption per meter squared of food production area and kilogram of food harvested. The scale on the vertical axis of each chart shows the overall consumption. Most of the water used was reported in October 2019 when the water-meter was read but used all over the year.
FOOD
The harvest chart, rather than showing harvest per month, shows the weight of the crops that were picked together with the quantity of kilograms per meter squared of food production area, which gives an indication of the intensity of production.
TRANSPORT
We have added a chart for trips to the garden, which in some cases generate a considerable consumption of fuel. This chart, however, needs to be interpreted. For example, in big cities such as New York or London, public transport is sometimes unavoidable and the quantity of kilometres may be also a consequence of the willingness of volunteers who do not live next to the garden to travel long distances. It may also indicate that a particular garden attracts many volunteers.
![]()
IMPACTS AND MOTIVATIONS
Finally, we have included two charts that show the motivations that most drive volunteers and gardeners to dedicate their time to grow food as well as the related impact on their wellbeing. The charts refer to answers given by all German case study participants and not to one single allotment plot holder.
The case study plot has a total size of about 540 m², of which about 335 m² are used for flower beds and lawn and 140 m² for food production (vegetables and fruits). As a typical German allotment plot it includes a brick garden-house of 24 m².
DASHBOARD
The charts included in this ‘dashboard’ show resources that have been used to grow food on the area cultivated with edible crops, the quantity of food that has been grown and the perceived immaterial benefits accrued through gardening, between March and the end of October 2019. Charts are based on the data that gardeners have collected with much dedication.
WATER
The water chart visualises in a bar the progressive consumption of water and electricity across some months of the year, together with the consumption per meter squared of food production area and kilogram of food harvested. The scale on the vertical axis of each chart shows the overall consumption.


FOOD
The harvest chart, rather than showing harvest per month, shows the weight of the crops that were picked together with the quantity of kilograms per meter squared of food production area, which gives an indication of the intensity of production.

TRANSPORT
We have added a chart for trips to the garden, which in some cases generate a considerable consumption of fuel. This chart, however, needs to be interpreted. For example, in big cities such as New York or London, public transport is sometimes unavoidable and the quantity of kilometres may be also a consequence of the willingness of volunteers who do not live next to the garden to travel long distances. It may also indicate that a particular garden attracts many volunteers.
![]()
IMPACTS AND MOTIVATIONS
Finally, we have included two charts that show the motivations that most drive volunteers and gardeners to dedicate their time to grow food as well as the related impact on their wellbeing. The charts refer to answers given by all German case study participants and not to one single allotment plot holder.
DASHBOARD
The charts included in this ‘dashboard’ show resources that have been used to grow food on the area cultivated with edible crops, the quantity of food that has been grown and the perceived immaterial benefits accrued through gardening, between March and the end of October 2019. Charts are based on the data that gardeners have collected with much dedication.
WATER
The water chart visualises in a bar the progressive consumption of water and electricity across some months of the year, together with the consumption per meter squared of food production area and kilogram of food harvested. The scale on the vertical axis of each chart shows the overall consumption.
FOOD
The harvest chart, rather than showing harvest per month, shows the weight of the crops that were picked together with the quantity of kilograms per meter squared of food production area, which gives an indication of the intensity of production.
TRANSPORT
We have added a chart for trips to the garden, which in some cases generate a considerable consumption of fuel. This chart, however, needs to be interpreted. For example, in big cities such as New York or London, public transport is sometimes unavoidable and the quantity of kilometres may be also a consequence of the willingness of volunteers who do not live next to the garden to travel long distances. It may also indicate that a particular garden attracts many volunteers.
![]()
IMPACTS AND MOTIVATIONS
Finally, we have included two charts that show the motivations that most drive volunteers and gardeners to dedicate their time to grow food as well as the related impact on their wellbeing. The charts refer to answers given by all German case study participants and not to one single allotment plot holder.
The case study plot has a total size of about 700m² due to the fact that the tenants have rented two adjacent allotment sites. The total are for cultivation for lawn, flower beds and food production is about 600 m² of which 180m² are used for growing vegetables and fruits. One of the two former brick-built gardenhouses has been demolished already while on the tenants have just started to replace the second by a modern house constructed from wood. as the site neighbours directly to orchards, tenants have established intensive bee-keeping facilities with 14 bee-hives.
DASHBOARD
The charts included in this ‘dashboard’ show resources that have been used to grow food on the area cultivated with edible crops, the quantity of food that has been grown and the perceived immaterial benefits accrued through gardening, between March and the end of October 2019. Charts are based on the data that gardeners have collected with much dedication.
WATER
The water chart visualises in a bar the progressive consumption of water and electricity across some months of the year, together with the consumption per meter squared of food production area and kilogram of food harvested. The scale on the vertical axis of each chart shows the overall consumption. The figure on water use may not reflect the amount of water used for watering the plants in this garden as partly a neighbour also used the hose with the water meter applied, and the children of the gardener liked playing with the lawn sprinkler.


FOOD
The harvest chart, rather than showing harvest per month, shows the weight of the crops that were picked together with the quantity of kilograms per meter squared of food production area, which gives an indication of the intensity of production.

TRANSPORT
We have added a chart for trips to the garden, which in some cases generate a considerable consumption of fuel. This chart, however, needs to be interpreted. For example, in big cities such as New York or London, public transport is sometimes unavoidable and the quantity of kilometres may be also a consequence of the willingness of volunteers who do not live next to the garden to travel long distances. It may also indicate that a particular garden attracts many volunteers.
![]()
IMPACTS AND MOTIVATIONS
Finally, we have included two charts that show the motivations that most drive volunteers and gardeners to dedicate their time to grow food as well as the related impact on their wellbeing. The charts refer to answers given by all German case study participants and not to one single allotment plot holder.
The case study plot has a total size of about 400 m². The total area for cultivation for flower beds and food production is about 328 m² of which 140 m² are used for growing vegetables and fruits.
DASHBOARD
The charts included in this ‘dashboard’ show resources that have been used to grow food on the area cultivated with edible crops, the quantity of food that has been grown and the perceived immaterial benefits accrued through gardening, between March and the end of October 2019. Charts are based on the data that gardeners have collected with much dedication.
WATER
The water chart visualises in a bar the progressive consumption of water and electricity across some months of the year, together with the consumption per meter squared of food production area and kilogram of food harvested. The scale on the vertical axis of each chart shows the overall consumption.
FOOD
The harvest chart, rather than showing harvest per month, shows the weight of the crops that were picked together with the quantity of kilograms per meter squared of food production area, which gives an indication of the intensity of production.
TRANSPORT
We have added a chart for trips to the garden, which in some cases generate a considerable consumption of fuel. This chart, however, needs to be interpreted. For example, in big cities such as New York or London, public transport is sometimes unavoidable and the quantity of kilometres may be also a consequence of the willingness of volunteers who do not live next to the garden to travel long distances. It may also indicate that a particular garden attracts many volunteers.
![]()
IMPACTS AND MOTIVATIONS
Finally, we have included two charts that show the motivations that most drive volunteers and gardeners to dedicate their time to grow food as well as the related impact on their wellbeing. The charts refer to answers given by all German case study participants and not to one single allotment plot holder.
DESCRIPTION:
Tulipan 1 is one of 255 plots included in the allotment garden. The total area of the case study plot is 411 m2. The current user has been taking care of the plot for nearly 38 years, that is since the very beginning of the allotment garden. The main benefit of having a plot is the opportunity to rest and recreation, but also to have healthy own fruits and vegetables. The cultivation area occupies 37% of the plot with vegetables such as parsley, leek, carrot, celeriac, green beans, butter lettuce and tomato.
DASHBOARD
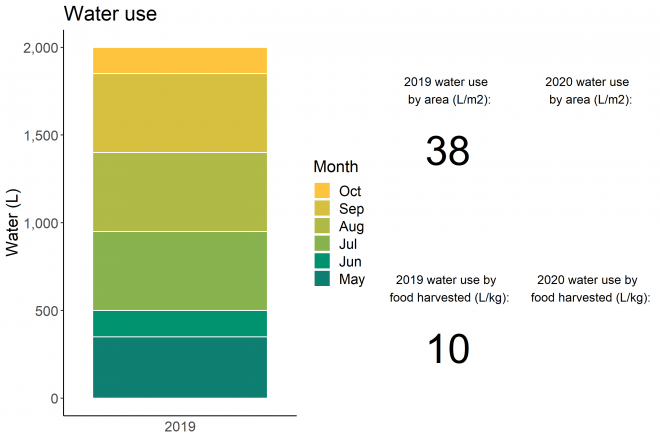
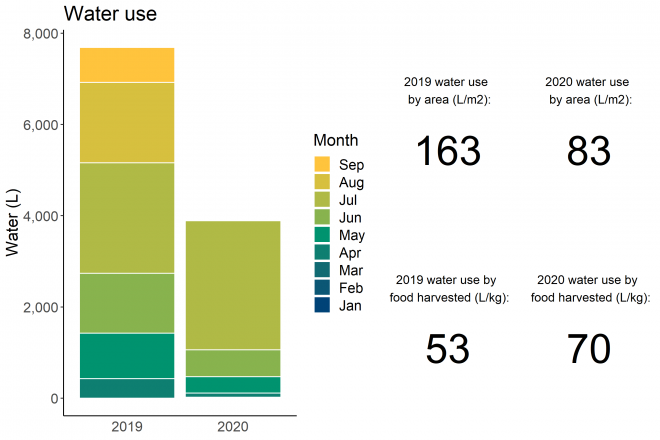
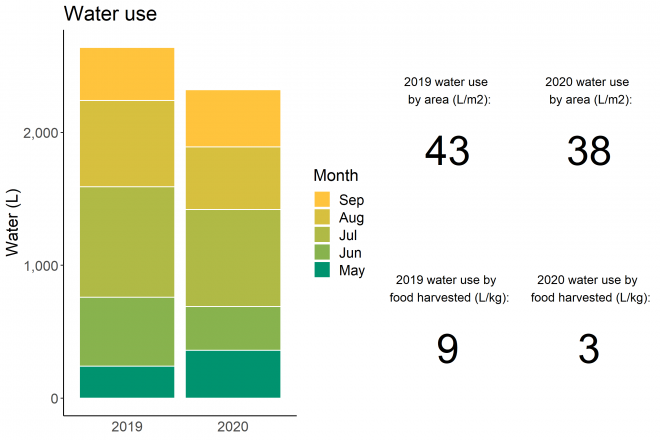
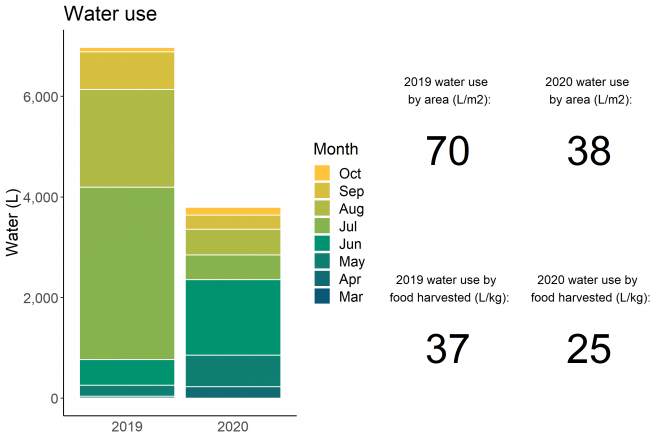
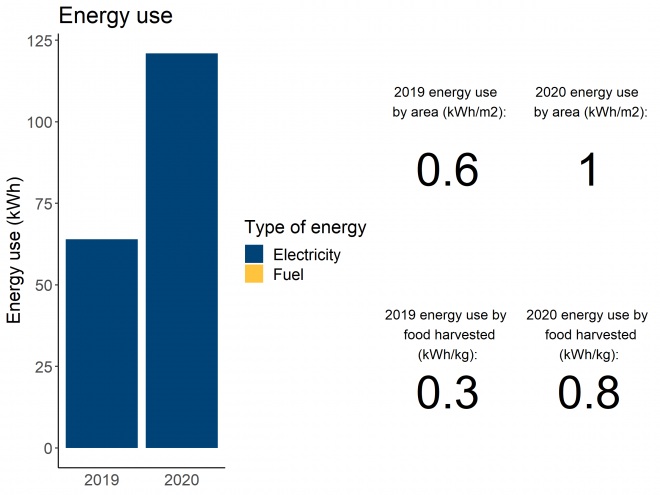
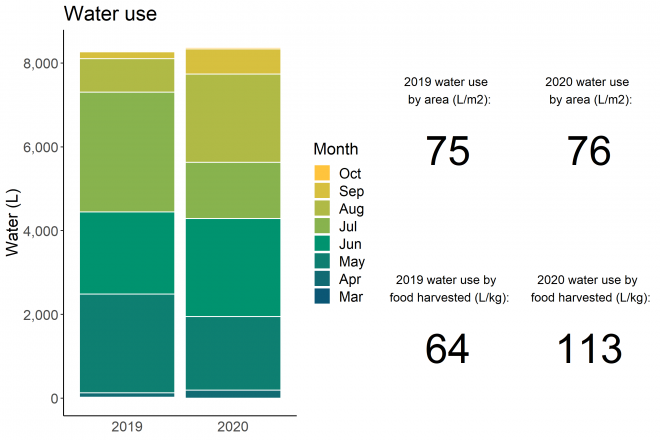
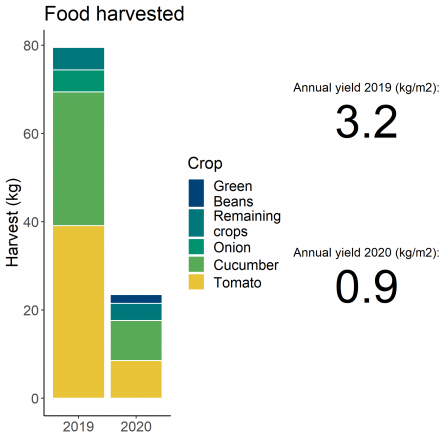
The charts included in this ‘dashboard’ show resources that have been used to grow food on the area cultivated with edible crops and the quantity of food that has been grown over two years, between March and October 2019, and March and October 2020. The last two sections of this page are dedicated to transport and the perceived immaterial benefits accrued through gardening. We decided to include transport in these charts because the fuel that is sometimes used for transport adds to the resources used to grow food.
In the last section of the page, two charts show immaterial benefits in terms of motivations for our gardeners to work in this community garden and the impact that this work generates on their health, socialisation and more. Transport, motivations and impacts were identified on the basis of a survey amongst gardeners and volunteers conducted in 2019.
All charts are based on the data that gardeners have collected with much dedication.
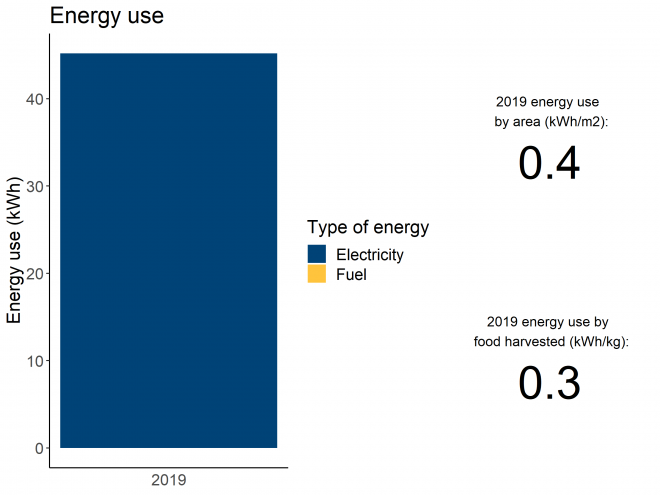
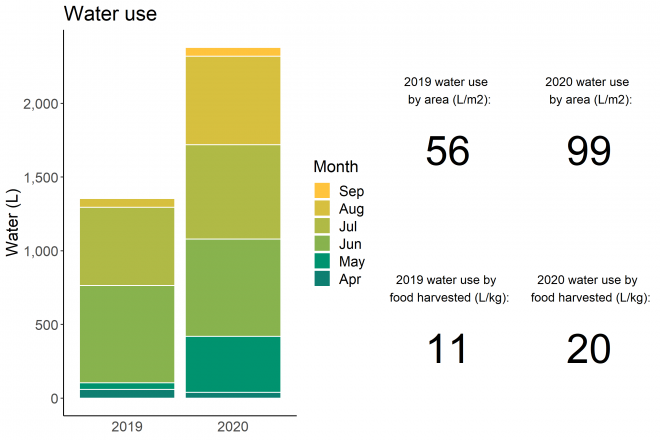
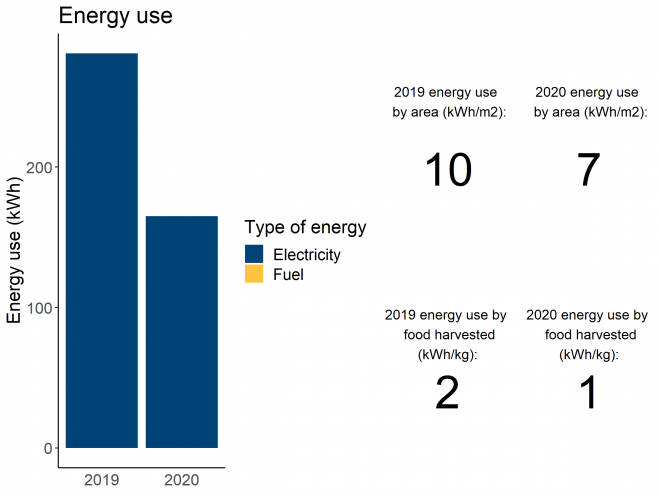
WATER
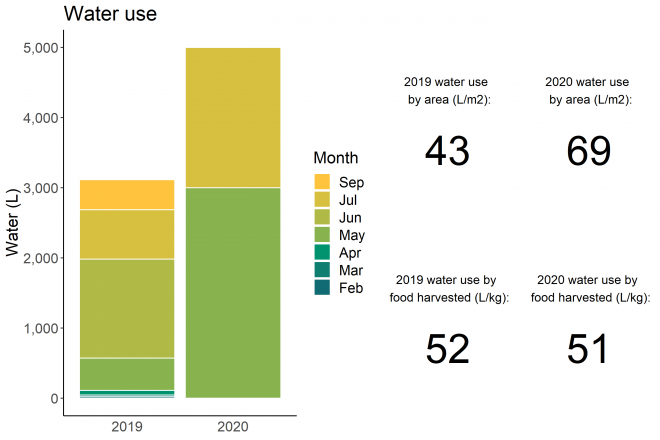
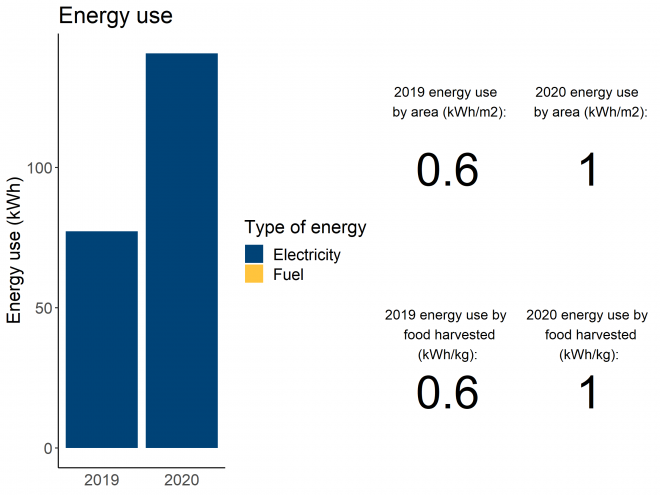
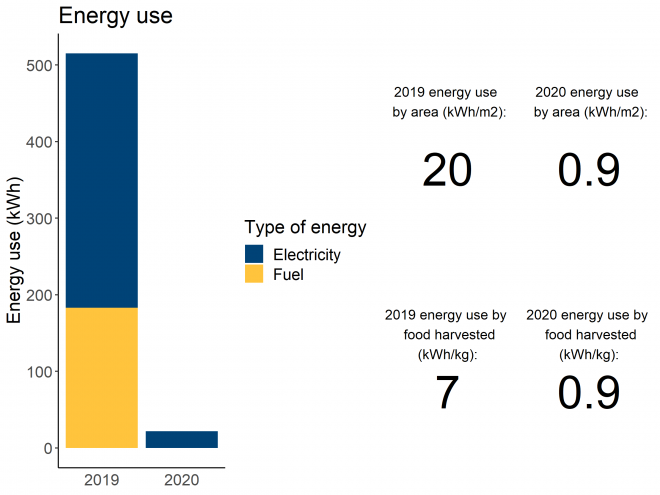
The water chart visualises in two bars the progressive consumption of water and electricity from March to October 2019 and 2020, together with the consumption per meter squared of food production area and kilogram of food harvested. The scale on the vertical axis of each chart shows the overall consumption. The garden is located next to offices and the electricity meter shows the overall consumption of the garden and offices. Electricity consumption of the garden is therefore based on an estimate and includes the energy consumed by the gardeners using facilities of the offices.
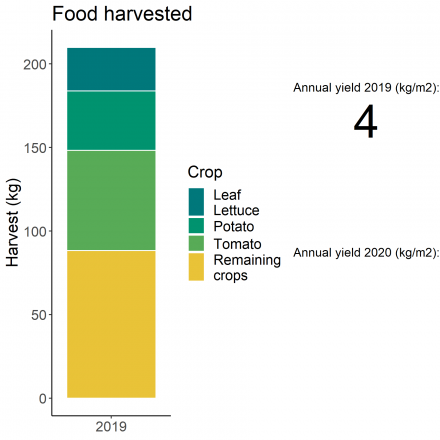
FOOD
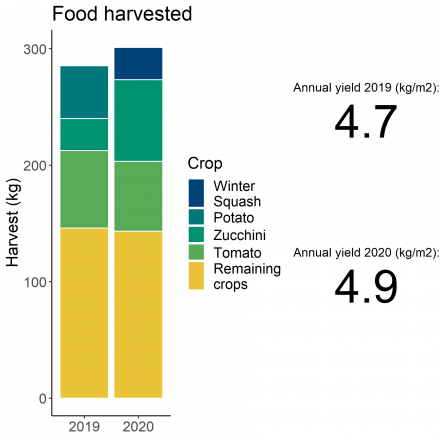
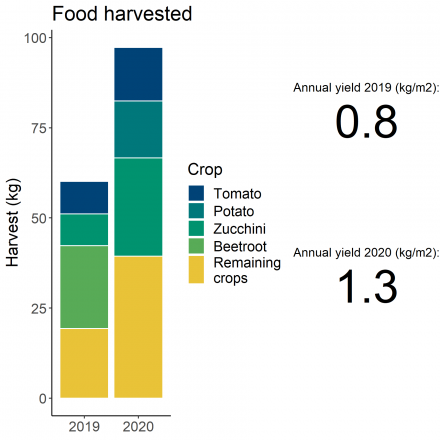
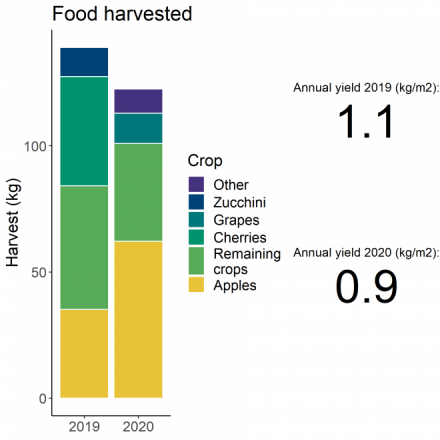
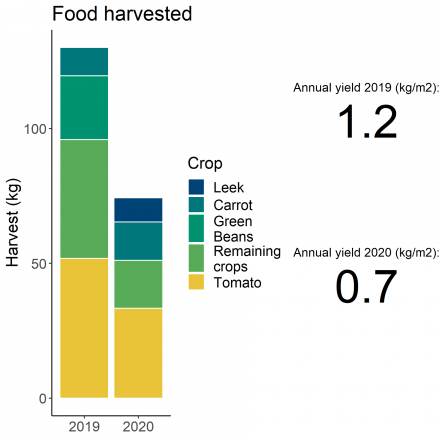
The harvest charts, rather than showing harvest per month, show the weight of the crops harvested together with the quantity of kilograms per m2 of food production area, which gives an indication of the intensity of production.
TRANSPORT
We have added a chart for trips to the garden, which in some cases generate a considerable consumption of fuel. This chart, however, needs to be interpreted. For example, in big cities such as New York or London, public transport is sometimes unavoidable and the quantity of kilometres may be also a consequence of the willingness of volunteers who do not live next to the garden to travel long distances. It may also indicate that a particular garden attracts many volunteers. For Polish case studies, commuting to the garden was recorded by only one gardener/plot user, even if the garden/plot was used by other people (e.g. other family members). This chart refers to trips in 2019 and 2020.
![]()
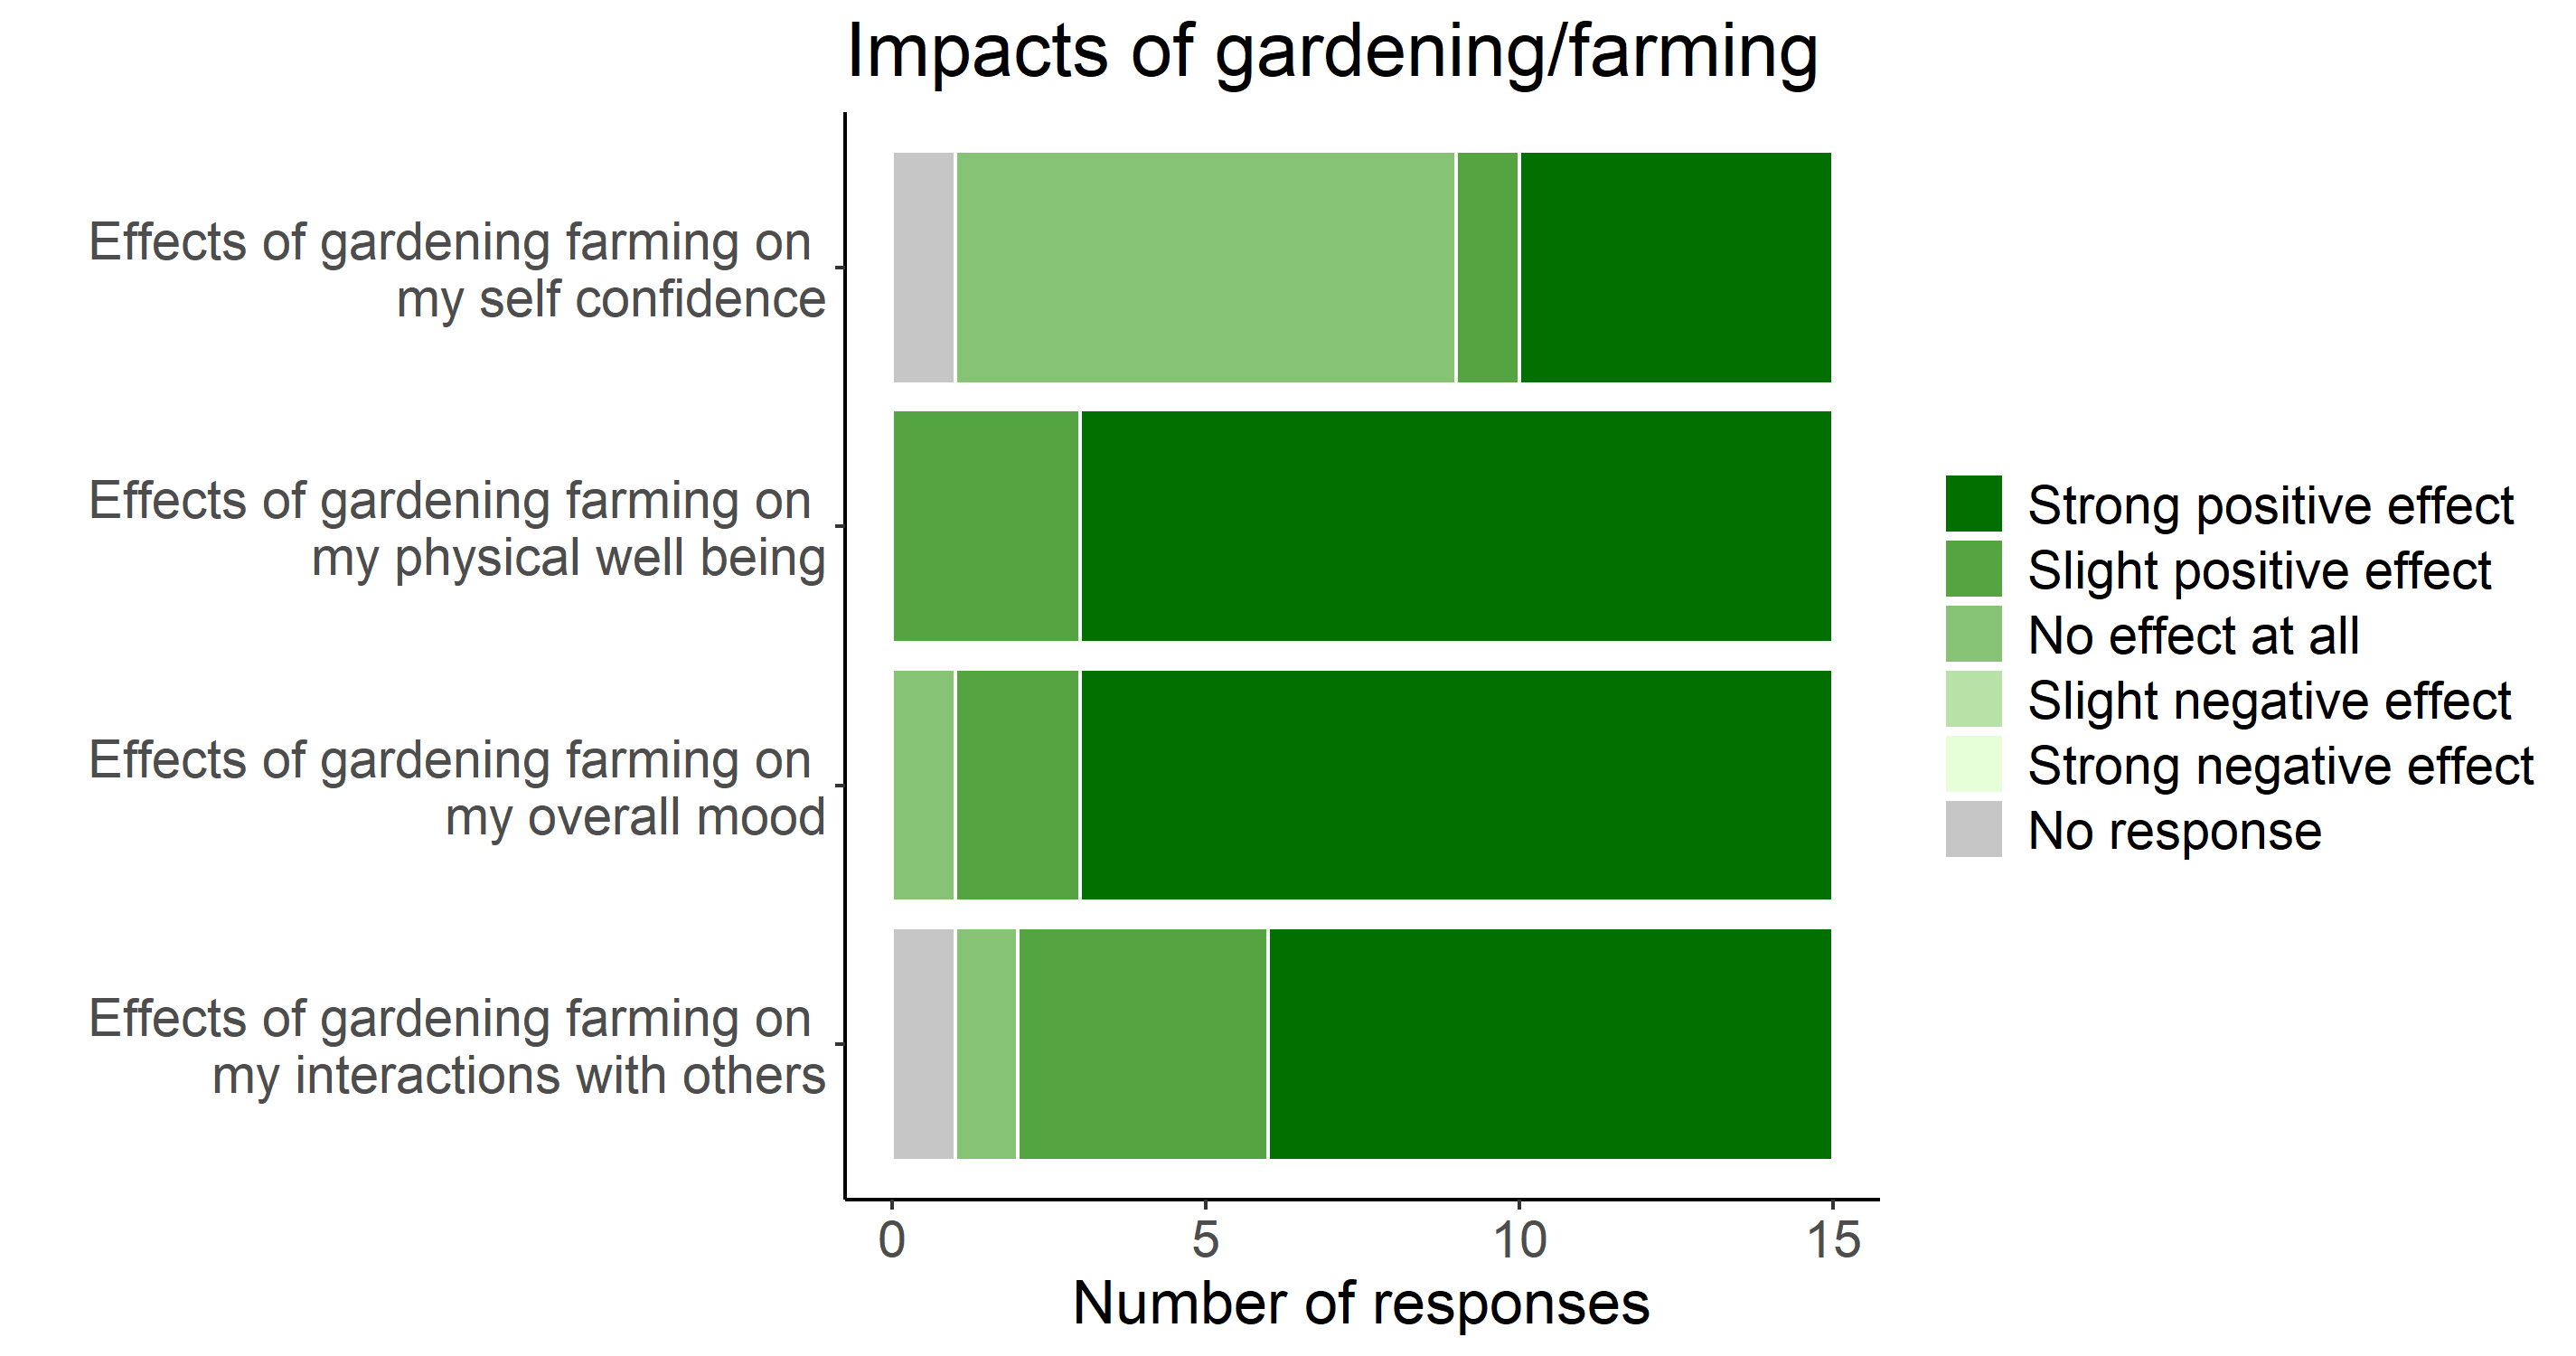
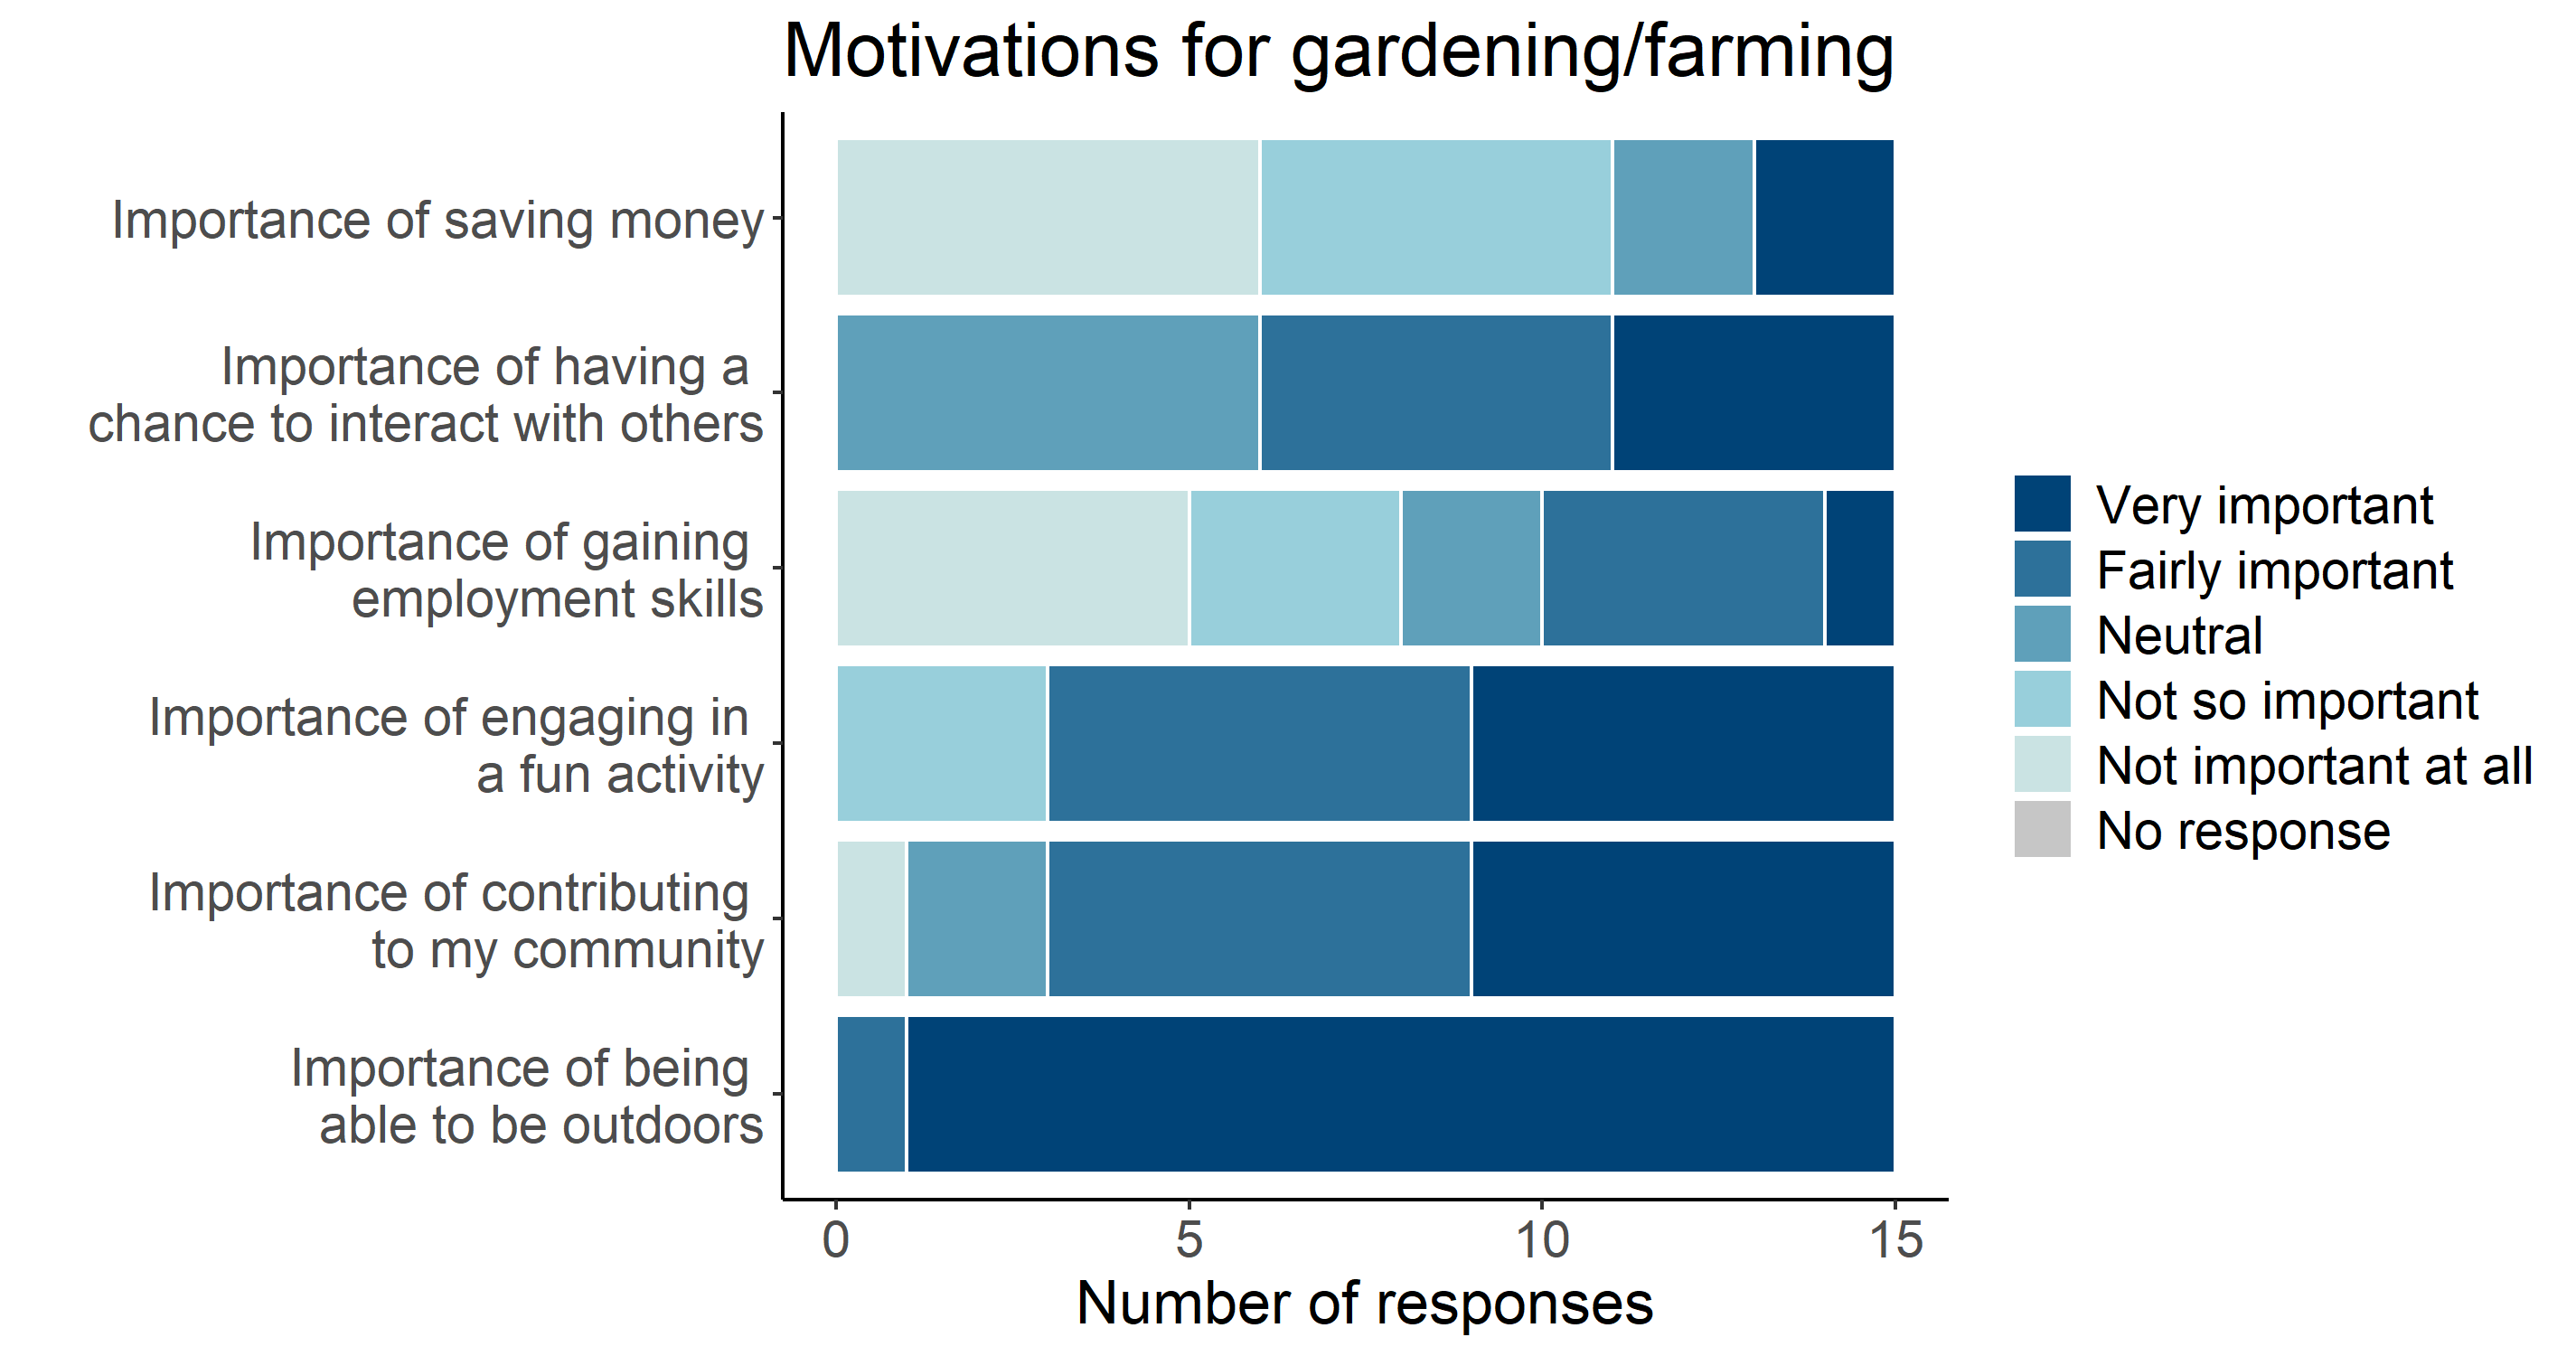
IMPACTS AND MOTIVATIONS
Finally, we have included two charts that show the motivations that most drive volunteers and gardeners to dedicate their time to grow food as well as the related impact on their wellbeing. This chart refers to impacts and motivations recorded in 2019.
TULIPAN 2 - is in Gorzów Wielkopolski, a city with nearly 125,000 inhabitants located in the west of Poland and is an allotment plot within Family Allotment Garden "Tulipan" which is associated with Polish Allotment Gardeners Federation, branch of Gorzów Wielkopolski. The allotment garden was established in 1982 and is located in the south of the city, surrounded by agriculture areas.
Tulipan 2 is one of 255 plots included in the allotment garden. The total area of the case study plot is 400 m2. The current user has been taking care of the plot for 34 years (since 1986). The main benefit of having a plot is the opportunity to rest and recreation, but also to have healthy own fruits and vegetables. The cultivation area occupies 43% of the plot with a wide range of vegetables and fruits.
DASHBOARD
The charts included in this ‘dashboard’ show resources that have been used to grow food on the area cultivated with edible crops and the quantity of food that has been grown over two years, between March and October 2019, and March and October 2020. The last two sections of this page are dedicated to transport and the perceived immaterial benefits accrued through gardening. We decided to include transport in these charts because the fuel that is sometimes used for transport adds to the resources used to grow food.
In the last section of the page, two charts show immaterial benefits in terms of motivations for our gardeners to work in this community garden and the impact that this work generates on their health, socialisation and more. Transport, motivations and impacts were identified on the basis of a survey amongst gardeners and volunteers conducted in 2019.
All charts are based on the data that gardeners have collected with much dedication.
WATER
The water chart visualises in two bars the progressive consumption of water and electricity from March to October 2019 and 2020, together with the consumption per meter squared of food production area and kilogram of food harvested. The scale on the vertical axis of each chart shows the overall consumption. The garden is located next to offices and the electricity meter shows the overall consumption of the garden and offices. Electricity consumption of the garden is therefore based on an estimate and includes the energy consumed by the gardeners using facilities of the offices.
FOOD
The harvest charts, rather than showing harvest per month, show the weight of the crops harvested together with the quantity of kilograms per m2 of food production area, which gives an indication of the intensity of production.
TRANSPORT
We have added a chart for trips to the garden, which in some cases generate a considerable consumption of fuel. This chart, however, needs to be interpreted. For example, in big cities such as New York or London, public transport is sometimes unavoidable and the quantity of kilometres may be also a consequence of the willingness of volunteers who do not live next to the garden to travel long distances. It may also indicate that a particular garden attracts many volunteers. For Polish case studies, commuting to the garden was recorded by only one gardener/plot user, even if the garden/plot was used by other people (e.g. other family members). This chart refers to trips in 2019 and 2020.
![]()
IMPACTS AND MOTIVATIONS
Finally, we have included two charts that show the motivations that most drive volunteers and gardeners to dedicate their time to grow food as well as the related impact on their wellbeing. This chart refers to impacts and motivations recorded in 2019.
TULIPAN 6 - is in Gorzów Wielkopolski, a city with nearly 125,000 inhabitants located in the west of Poland and is an allotment plot within Family Allotment Garden "Tulipan," which is associated with Polish Allotment Gardeners Federation, branch of Gorzów Wielkopolski. The allotment garden was established in 1982 and is located in the south of the city, surrounded by agriculture areas.
Tulipan 6 is one of 255 plots included in the allotment garden. The total area of the case study plot is 408 m2. The current user has been taking care of the plot for 35 years (since 1985). The main benefit of having a plot is the opportunity to rest and recreation, but also to have healthy own fruits and vegetables. The cultivation area occupies 60% of the plot with such vegetables as butter lettuce, cucumber, radish, carrot, peas and fruits as strawberries.
DASHBOARD
The charts included in this ‘dashboard’ show resources that have been used to grow food on the area cultivated with edible crops and the quantity of food that has been grown over two years, between March and October 2019, and March and October 2020. The last two sections of this page are dedicated to transport and the perceived immaterial benefits accrued through gardening. We decided to include transport in these charts because the fuel that is sometimes used for transport adds to the resources used to grow food.
In the last section of the page, two charts show immaterial benefits in terms of motivations for our gardeners to work in this community garden and the impact that this work generates on their health, socialisation and more. Transport, motivations and impacts were identified on the basis of a survey amongst gardeners and volunteers conducted in 2019.
All charts are based on the data that gardeners have collected with much dedication.
WATER
The water chart visualises in two bars the progressive consumption of water and electricity from March to October 2019 and 2020, together with the consumption per meter squared of food production area and kilogram of food harvested. The scale on the vertical axis of each chart shows the overall consumption. The garden is located next to offices and the electricity meter shows the overall consumption of the garden and offices. Electricity consumption of the garden is therefore based on an estimate and includes the energy consumed by the gardeners using facilities of the offices.
FOOD
The harvest charts, rather than showing harvest per month, show the weight of the crops harvested together with the quantity of kilograms per m2 of food production area, which gives an indication of the intensity of production.
TRANSPORT
We have added a chart for trips to the garden, which in some cases generate a considerable consumption of fuel. This chart, however, needs to be interpreted. For example, in big cities such as New York or London, public transport is sometimes unavoidable and the quantity of kilometres may be also a consequence of the willingness of volunteers who do not live next to the garden to travel long distances. It may also indicate that a particular garden attracts many volunteers. For Polish case studies, commuting to the garden was recorded by only one gardener/plot user, even if the garden/plot was used by other people (e.g. other family members). This chart refers to trips in 2019 and 2020.
![]()
IMPACTS AND MOTIVATIONS
Finally, we have included two charts that show the motivations that most drive volunteers and gardeners to dedicate their time to grow food as well as the related impact on their wellbeing. This chart refers to impacts and motivations recorded in 2019.
USTRONIE 1 - is in Gorzów Wielkopolski, a city with nearly 125,000 inhabitants located in the west of Poland and is an allotment plot within Family Allotment Garden "Ustronie", which is associated with Polish Allotment Gardeners Federation, branch of Gorzów Wielkopolski. The allotment garden was established in 1975 and is located in the central-eastern part of the city, surrounded by railway areas and Varta river meadows.
Ustronie 1 is one of 164 plots included in the allotment garden. The total area of the case study plot is 290 m2. The current user has been taking care of the plot for more than ten years (since 2009). The main benefit of having a plot is the opportunity to rest and recreation, but also to have healthy own fruits and vegetables. The cultivation area occupies 25% of the total area of the plot with such vegetables as onion, cucumber, tomato and chives.
DASHBOARD
The charts included in this ‘dashboard’ show resources that have been used to grow food on the area cultivated with edible crops and the quantity of food that has been grown over two years, between March and October 2019, and March and October 2020. The last two sections of this page are dedicated to transport and the perceived immaterial benefits accrued through gardening. We decided to include transport in these charts because the fuel that is sometimes used for transport adds to the resources used to grow food.
In the last section of the page, two charts show immaterial benefits in terms of motivations for our gardeners to work in this community garden and the impact that this work generates on their health, socialisation and more. Transport, motivations and impacts were identified on the basis of a survey amongst gardeners and volunteers conducted in 2019.
All charts are based on the data that gardeners have collected with much dedication.
WATER
The water chart visualises in two bars the progressive consumption of water and electricity from March to October 2019 and 2020, together with the consumption per meter squared of food production area and kilogram of food harvested. The scale on the vertical axis of each chart shows the overall consumption. The garden is located next to offices and the electricity meter shows the overall consumption of the garden and offices. Electricity consumption of the garden is therefore based on an estimate and includes the energy consumed by the gardeners using facilities of the offices.
FOOD
The harvest charts, rather than showing harvest per month, show the weight of the crops harvested together with the quantity of kilograms per m2 of food production area, which gives an indication of the intensity of production.
TRANSPORT
We have added a chart for trips to the garden, which in some cases generate a considerable consumption of fuel. This chart, however, needs to be interpreted. For example, in big cities such as New York or London, public transport is sometimes unavoidable and the quantity of kilometres may be also a consequence of the willingness of volunteers who do not live next to the garden to travel long distances. It may also indicate that a particular garden attracts many volunteers. For Polish case studies, commuting to the garden was recorded by only one gardener/plot user, even if the garden/plot was used by other people (e.g. other family members). This chart refers to trips in 2019 and 2020.
![]()
IMPACTS AND MOTIVATIONS
Finally, we have included two charts that show the motivations that most drive volunteers and gardeners to dedicate their time to grow food as well as the related impact on their wellbeing. This chart refers to impacts and motivations recorded in 2019.
USTRONIE 5 - is in Gorzów Wielkopolski, a city with nearly 125,000 inhabitants located in the west of Poland and is an allotment plot within Family Allotment Garden "Ustronie", which is associated with Polish Allotment Gardeners Federation, branch of Gorzów Wielkopolski. The allotment garden was established in 1975 and is located in the central-eastern part of the city, surrounded by railway areas and Varta river meadows.
Ustronie 5 is one of 164 plots included in the allotment garden. The total area of the case study plot is 288 m2. The current users have been taking care of the plot for more than five years. The main benefit of having a plot is the opportunity to rest and recreation, but also to have healthy own fruits and vegetables. The cultivation area occupies more than a third part of the plot with such vegetables as tomato, cucumber onion and others. They share the surpluses with the family.
DASHBOARD
The charts included in this ‘dashboard’ show resources that have been used to grow food on the area cultivated with edible crops and the quantity of food that has been grown over two years, between March and October 2019, and March and October 2020. The last two sections of this page are dedicated to transport and the perceived immaterial benefits accrued through gardening. We decided to include transport in these charts because the fuel that is sometimes used for transport adds to the resources used to grow food.
In the last section of the page, two charts show immaterial benefits in terms of motivations for our gardeners to work in this community garden and the impact that this work generates on their health, socialisation and more. Transport, motivations and impacts were identified on the basis of a survey amongst gardeners and volunteers conducted in 2019.
All charts are based on the data that gardeners have collected with much dedication.
WATER
The water chart visualises in two bars the progressive consumption of water and electricity from March to October 2019 and 2020, together with the consumption per meter squared of food production area and kilogram of food harvested. The scale on the vertical axis of each chart shows the overall consumption. The garden is located next to offices and the electricity meter shows the overall consumption of the garden and offices. Electricity consumption of the garden is therefore based on an estimate and includes the energy consumed by the gardeners using facilities of the offices.
FOOD
The harvest charts, rather than showing harvest per month, show the weight of the crops harvested together with the quantity of kilograms per m2 of food production area, which gives an indication of the intensity of production.
TRANSPORT
We have added a chart for trips to the garden, which in some cases generate a considerable consumption of fuel. This chart, however, needs to be interpreted. For example, in big cities such as New York or London, public transport is sometimes unavoidable and the quantity of kilometres may be also a consequence of the willingness of volunteers who do not live next to the garden to travel long distances. It may also indicate that a particular garden attracts many volunteers. For Polish case studies, commuting to the garden was recorded by only one gardener/plot user, even if the garden/plot was used by other people (e.g. other family members). This chart refers to trips in 2019 and 2020.
![]()
IMPACTS AND MOTIVATIONS
Finally, we have included two charts that show the motivations that most drive volunteers and gardeners to dedicate their time to grow food as well as the related impact on their wellbeing. This chart refers to impacts and motivations recorded in 2019.
MALWA 1 - is in Gorzów Wielkopolski, a city with nearly 125,000 inhabitants located in the west of Poland and is an allotment plot within Family Allotment Garden "Malwa", which is associated with Polish Allotment Gardeners Federation, branch of Gorzów Wielkopolski. The allotment garden was established in 1977 and is located in the south of the city, surrounded by agriculture areas.
Malwa 1 is a one of 519 plots included in the allotment garden. Total area of the case study plot is 350 m2. The current user has been taking care of the plot for 33 years (since 1987). The main benefit of having a plot is the opportunity to rest and recreation, but also to have healthy own fruits and vegetables. The cultivation area occupies 45% of the total area of the plot with such vegetables as parsley, carrot, beetroot, celeriac, leek, tomato and also strawberries.
DASHBOARD
The charts included in this ‘dashboard’ show resources that have been used to grow food on the area cultivated with edible crops and the quantity of food that has been grown over two years, between March and October 2019, and March and October 2020. The last two sections of this page are dedicated to transport and the perceived immaterial benefits accrued through gardening. We decided to include transport in these charts because the fuel that is sometimes used for transport adds to the resources used to grow food.
In the last section of the page, two charts show immaterial benefits in terms of motivations for our gardeners to work in this community garden and the impact that this work generates on their health, socialisation and more. Transport, motivations and impacts were identified on the basis of a survey amongst gardeners and volunteers conducted in 2019.
All charts are based on the data that gardeners have collected with much dedication.
WATER
The water chart visualises in two bars the progressive consumption of water and electricity from March to October 2019 and 2020, together with the consumption per meter squared of food production area and kilogram of food harvested. The scale on the vertical axis of each chart shows the overall consumption. The garden is located next to offices and the electricity meter shows the overall consumption of the garden and offices. Electricity consumption of the garden is therefore based on an estimate and includes the energy consumed by the gardeners using facilities of the offices.
FOOD
The harvest charts, rather than showing harvest per month, show the weight of the crops harvested together with the quantity of kilograms per m2 of food production area, which gives an indication of the intensity of production.
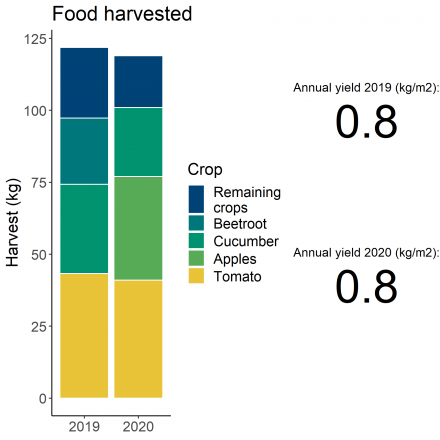
TRANSPORT
We have added a chart for trips to the garden, which in some cases generate a considerable consumption of fuel. This chart, however, needs to be interpreted. For example, in big cities such as New York or London, public transport is sometimes unavoidable and the quantity of kilometres may be also a consequence of the willingness of volunteers who do not live next to the garden to travel long distances. It may also indicate that a particular garden attracts many volunteers. For Polish case studies, commuting to the garden was recorded by only one gardener/plot user, even if the garden/plot was used by other people (e.g. other family members). This chart refers to trips in 2019 and 2020.
![]()
IMPACTS AND MOTIVATIONS
Finally, we have included two charts that show the motivations that most drive volunteers and gardeners to dedicate their time to grow food as well as the related impact on their wellbeing. This chart refers to impacts and motivations recorded in 2019.
NOWALIJKA 1 - is in Gorzów Wielkopolski, a city with nearly 125,000 inhabitants located in the west of Poland and is an allotment plot within Family Allotment Garden "Nowalijka", which is associated with Polish Allotment Gardeners Federation, branch of Gorzów Wielkopolski. The allotment garden was established in 1984 and is located in the north of the city, surrounded by agriculture, residential and industrial areas.
Nowalijka 1 is one of 142 plots included in the allotment garden. The total area of the case study plot is 295 m2. The current user has been taking care of the plot for 21 years (since 1999). The main benefit of having a plot is the opportunity to rest and recreation, but also to have healthy own fruits and vegetables. Mainly there are grown: carrot, tomato, cucumber, zucchini, leek, beetroot and pepper.
DASHBOARD
The charts included in this ‘dashboard’ show resources that have been used to grow food on the area cultivated with edible crops and the quantity of food that has been grown over two years, between March and October 2019, and March and October 2020. The last two sections of this page are dedicated to transport and the perceived immaterial benefits accrued through gardening. We decided to include transport in these charts because the fuel that is sometimes used for transport adds to the resources used to grow food.
In the last section of the page, two charts show immaterial benefits in terms of motivations for our gardeners to work in this community garden and the impact that this work generates on their health, socialisation and more. Transport, motivations and impacts were identified on the basis of a survey amongst gardeners and volunteers conducted in 2019.
All charts are based on the data that gardeners have collected with much dedication.
WATER
The water chart visualises in two bars the progressive consumption of water and electricity from March to October 2019 and 2020, together with the consumption per meter squared of food production area and kilogram of food harvested. The scale on the vertical axis of each chart shows the overall consumption. The garden is located next to offices and the electricity meter shows the overall consumption of the garden and offices. Electricity consumption of the garden is therefore based on an estimate and includes the energy consumed by the gardeners using facilities of the offices.
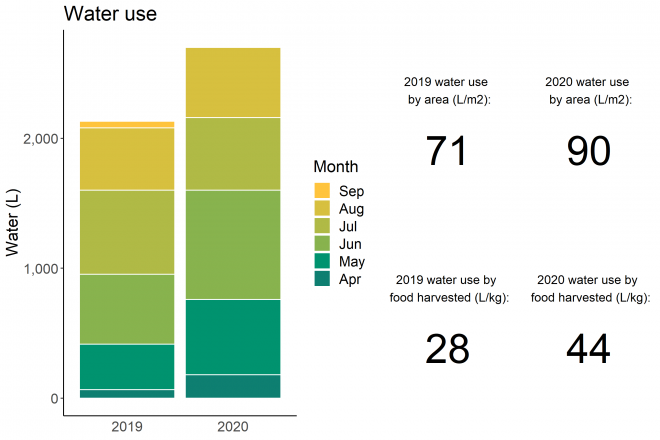
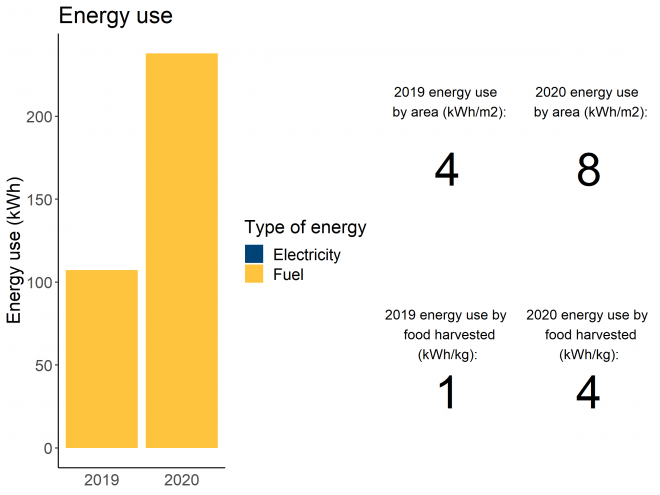
FOOD
The harvest charts, rather than showing harvest per month, show the weight of the crops harvested together with the quantity of kilograms per m2 of food production area, which gives an indication of the intensity of production.
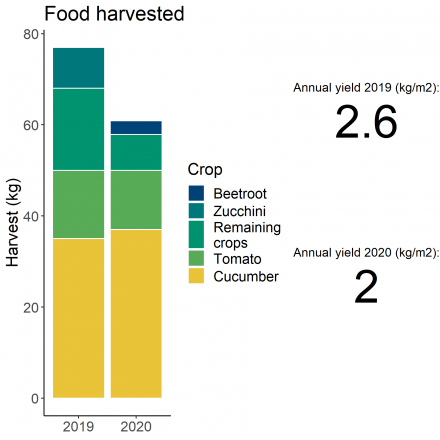
TRANSPORT
We have added a chart for trips to the garden, which in some cases generate a considerable consumption of fuel. This chart, however, needs to be interpreted. For example, in big cities such as New York or London, public transport is sometimes unavoidable and the quantity of kilometres may be also a consequence of the willingness of volunteers who do not live next to the garden to travel long distances. It may also indicate that a particular garden attracts many volunteers. For Polish case studies, commuting to the garden was recorded by only one gardener/plot user, even if the garden/plot was used by other people (e.g. other family members). This chart refers to trips in 2019 and 2020.
![]()
IMPACTS AND MOTIVATIONS
Finally, we have included two charts that show the motivations that most drive volunteers and gardeners to dedicate their time to grow food as well as the related impact on their wellbeing. This chart refers to impacts and motivations recorded in 2019.
NOWALIJKA 4 - is in Gorzów Wielkopolski, city with nearly 125,000 inhabitants located in the west of Poland and is an allotment plot within Family Allotment Garden "Nowalijka", which is associated with Polish Allotment Gardeners Federation, branch of Gorzów Wielkopolski. The allotment garden was established in 1984 and is located in the north of the city, surrounded by agriculture, residential and industrial areas.
Nowalijka 4 is one of 142 plots included in the allotment garden. The total area of the case study plot is 430 m2. The current user has been taking care of the plot for 32 years (sicne 1988). The main benefit of having a plot is the opportunity to rest and recreation, but also to have healthy own fruits and vegetables. Mainly there are grown: carrot, tomato and cucumber.
DASHBOARD
The charts included in this ‘dashboard’ show resources that have been used to grow food on the area cultivated with edible crops and the quantity of food that has been grown over two years, between March and October 2019, and March and October 2020. The last two sections of this page are dedicated to transport and the perceived immaterial benefits accrued through gardening. We decided to include transport in these charts because the fuel that is sometimes used for transport adds to the resources used to grow food.
In the last section of the page, two charts show immaterial benefits in terms of motivations for our gardeners to work in this community garden and the impact that this work generates on their health, socialisation and more. Transport, motivations and impacts were identified on the basis of a survey amongst gardeners and volunteers conducted in 2019.
All charts are based on the data that gardeners have collected with much dedication.
WATER
The water chart visualises in two bars the progressive consumption of water and electricity from March to October 2019 and 2020, together with the consumption per meter squared of food production area and kilogram of food harvested. The scale on the vertical axis of each chart shows the overall consumption. The garden is located next to offices and the electricity meter shows the overall consumption of the garden and offices. Electricity consumption of the garden is therefore based on an estimate and includes the energy consumed by the gardeners using facilities of the offices.
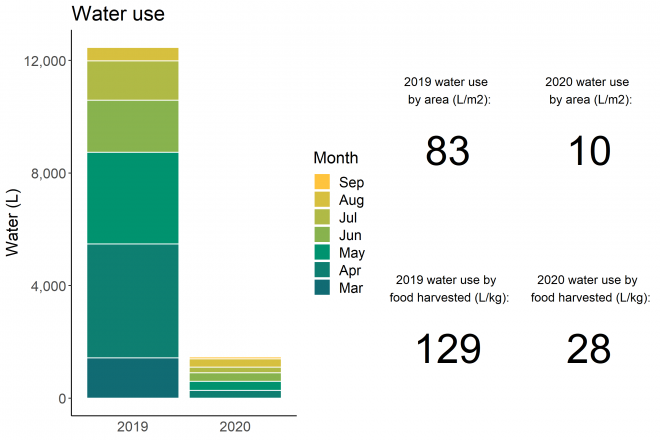
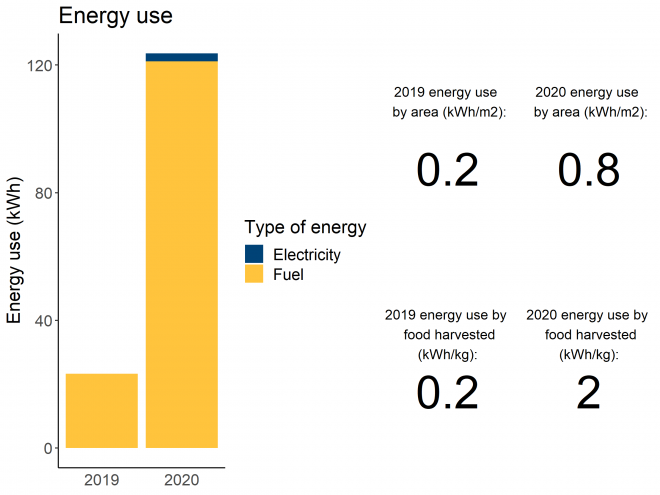
FOOD
The harvest charts, rather than showing harvest per month, show the weight of the crops harvested together with the quantity of kilograms per m2 of food production area, which gives an indication of the intensity of production.
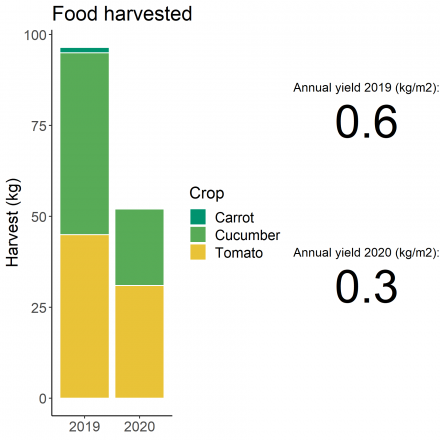
TRANSPORT
We have added a chart for trips to the garden, which in some cases generate a considerable consumption of fuel. This chart, however, needs to be interpreted. For example, in big cities such as New York or London, public transport is sometimes unavoidable and the quantity of kilometres may be also a consequence of the willingness of volunteers who do not live next to the garden to travel long distances. It may also indicate that a particular garden attracts many volunteers. For Polish case studies, commuting to the garden was recorded by only one gardener/plot user, even if the garden/plot was used by other people (e.g. other family members). This chart refers to trips in 2019 and 2020.
![]()
IMPACTS AND MOTIVATIONS
Finally, we have included two charts that show the motivations that most drive volunteers and gardeners to dedicate their time to grow food as well as the related impact on their wellbeing. This chart refers to impacts and motivations recorded in 2019.
METALOWIEC 4 - is in Gorzów Wielkopolski, a city with nearly 125,000 inhabitants located in the west of Poland and is an allotment plot within Family Allotment Garden "Metalowiec", which is associated with Polish Allotment Gardeners Federation, branch of Gorzów Wielkopolski. The allotment garden was established in 1959 and is located in the eastern-south part of of the city, surrounded by residential and agriculture areas.
Metalowiec 4 is one of 352 plots included in the allotment garden. Total area of the case study plot is 277 m2. The current user has been taking care of the plot for 2 years (sine 2018). The main benefit of having a plot is the opportunity to rest and recreation, but also to have healthy own fruits and vegetables. Mainly there are grown: carrot, tomato, parsley, butter lettuce, radish and basil.
DASHBOARD
The charts included in this ‘dashboard’ show resources that have been used to grow food on the area cultivated with edible crops and the quantity of food that has been grown over two years, between March and October 2019, and March and October 2020. The last two sections of this page are dedicated to transport and the perceived immaterial benefits accrued through gardening. We decided to include transport in these charts because the fuel that is sometimes used for transport adds to the resources used to grow food.
In the last section of the page, two charts show immaterial benefits in terms of motivations for our gardeners to work in this community garden and the impact that this work generates on their health, socialisation and more. Transport, motivations and impacts were identified on the basis of a survey amongst gardeners and volunteers conducted in 2019.
All charts are based on the data that gardeners have collected with much dedication.
WATER
The water chart visualises in two bars the progressive consumption of water and electricity from March to October 2019 and 2020, together with the consumption per meter squared of food production area and kilogram of food harvested. The scale on the vertical axis of each chart shows the overall consumption. The garden is located next to offices and the electricity meter shows the overall consumption of the garden and offices. Electricity consumption of the garden is therefore based on an estimate and includes the energy consumed by the gardeners using facilities of the offices.
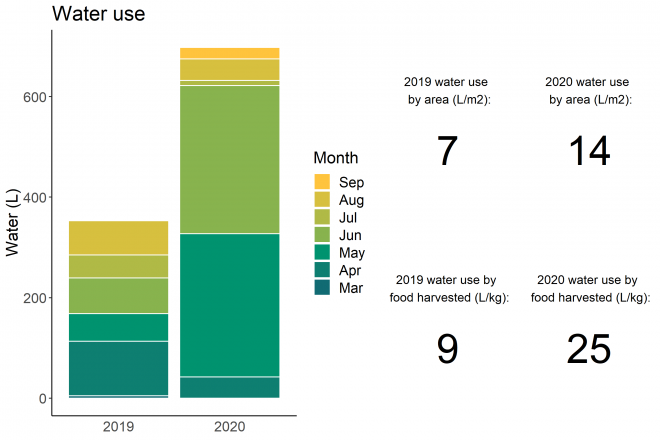
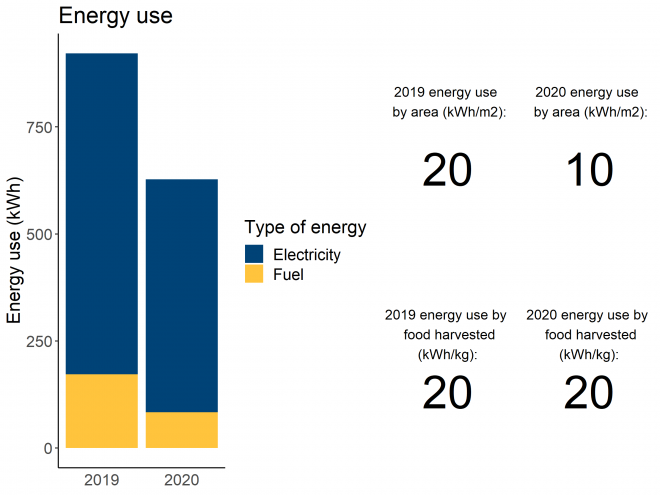
FOOD
The harvest charts, rather than showing harvest per month, show the weight of the crops harvested together with the quantity of kilograms per m2 of food production area, which gives an indication of the intensity of production.
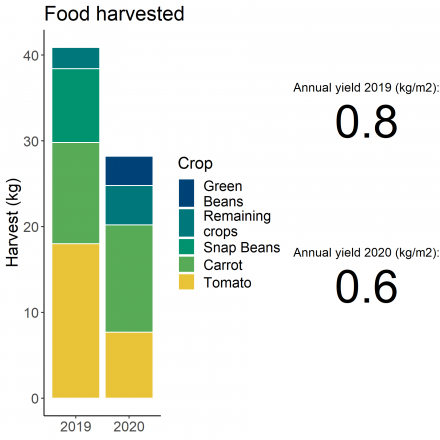
TRANSPORT
We have added a chart for trips to the garden, which in some cases generate a considerable consumption of fuel. This chart, however, needs to be interpreted. For example, in big cities such as New York or London, public transport is sometimes unavoidable and the quantity of kilometres may be also a consequence of the willingness of volunteers who do not live next to the garden to travel long distances. It may also indicate that a particular garden attracts many volunteers. For Polish case studies, commuting to the garden was recorded by only one gardener/plot user, even if the garden/plot was used by other people (e.g. other family members). This chart refers to trips in 2019 and 2020.
![]()
IMPACTS AND MOTIVATIONS
Finally, we have included two charts that show the motivations that most drive volunteers and gardeners to dedicate their time to grow food as well as the related impact on their wellbeing. This chart refers to impacts and motivations recorded in 2019.
METALOWIEC 5 - is in Gorzów Wielkopolski, a city with nearly 125,000 inhabitants located in the west of Poland and is an allotment plot within Family Allotment Garden "Metalowiec", which is associated with Polish Allotment Gardeners Federation, branch of Gorzów Wielkopolski. The allotment garden was established in 1959 and is located in the eastern-south part of the city, surrounded by residential and agriculture areas.
Metalowiec 5 is one of 352 plots included in the allotment garden. The total area of the case study plot is 291 m2. The current user has been taking care of the plot for 2 years (since 2018). The main benefit of having a plot is the opportunity to rest and recreation, but also to have healthy own fruits and vegetables. Mainly there are grown: parsley, garlic, cauliflower, tomato, onion, cucumber, radish, beetroot, carrot, kohlrabi, lettuce, pepper, strawberries and raspberries.
DASHBOARD
The charts included in this ‘dashboard’ show resources that have been used to grow food on the area cultivated with edible crops and the quantity of food that has been grown over two years, between March and October 2019, and March and October 2020. The last two sections of this page are dedicated to transport and the perceived immaterial benefits accrued through gardening. We decided to include transport in these charts because the fuel that is sometimes used for transport adds to the resources used to grow food.
In the last section of the page, two charts show immaterial benefits in terms of motivations for our gardeners to work in this community garden and the impact that this work generates on their health, socialisation and more. Transport, motivations and impacts were identified on the basis of a survey amongst gardeners and volunteers conducted in 2019.
All charts are based on the data that gardeners have collected with much dedication.
WATER
The water chart visualises in two bars the progressive consumption of water and electricity from March to October 2019 and 2020, together with the consumption per meter squared of food production area and kilogram of food harvested. The scale on the vertical axis of each chart shows the overall consumption. The garden is located next to offices and the electricity meter shows the overall consumption of the garden and offices. Electricity consumption of the garden is therefore based on an estimate and includes the energy consumed by the gardeners using facilities of the offices.
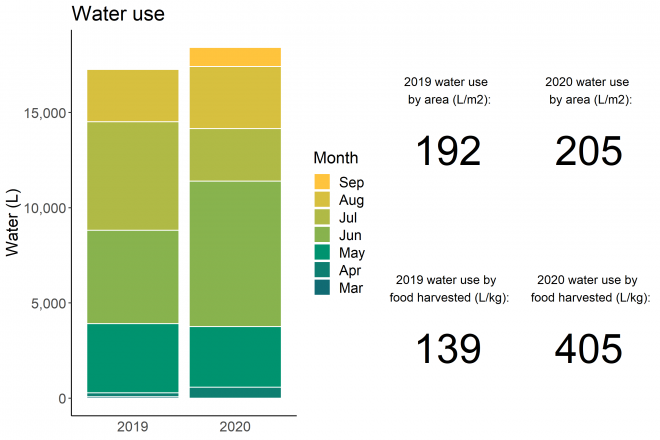
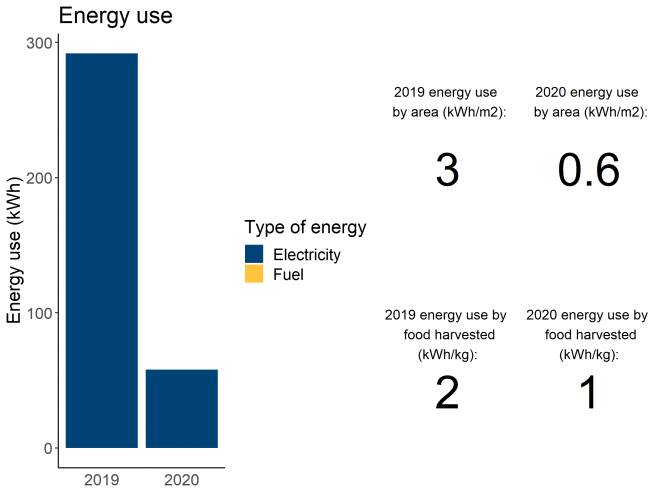
FOOD
The harvest charts, rather than showing harvest per month, show the weight of the crops harvested together with the quantity of kilograms per m2 of food production area, which gives an indication of the intensity of production.
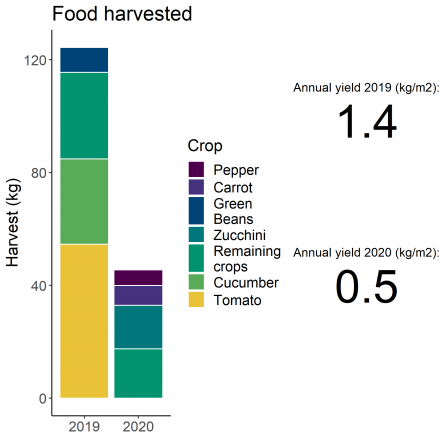
TRANSPORT
We have added a chart for trips to the garden, which in some cases generate a considerable consumption of fuel. This chart, however, needs to be interpreted. For example, in big cities such as New York or London, public transport is sometimes unavoidable and the quantity of kilometres may be also a consequence of the willingness of volunteers who do not live next to the garden to travel long distances. It may also indicate that a particular garden attracts many volunteers. For Polish case studies, commuting to the garden was recorded by only one gardener/plot user, even if the garden/plot was used by other people (e.g. other family members). This chart refers to trips in 2019 and 2020.
![]()
IMPACTS AND MOTIVATIONS
Finally, we have included two charts that show the motivations that most drive volunteers and gardeners to dedicate their time to grow food as well as the related impact on their wellbeing. This chart refers to impacts and motivations recorded in 2019.
GORZOW 2 is a small gardening farm in the northern part of Gorzow Wielkopolski. The farm has been operating since 1973. The main purpose of the farm is to provide fresh vegetables and fruits to the market. Initially, it was the production of vegetables as well as strawberries and raspberries in the ground. From 1975, vegetables have also been grown in cold and heated foil tunnels. There are currently three tunnels on the farm.
The farm produces vegetables such as carrots, celery, leeks, parsley, green beans, cucumbers, zucchini, pumpkins, rhubarb, tomatoes, lettuce, cabbage, also chives, dill, lovage. Crops from the farm are sold locally nearby the farm in Gorzow Wielkopolski at a small market, where the farm owner has a stall.
DASHBOARD
The charts included in this ‘dashboard’ show resources that have been used to grow food on the area cultivated with edible crops and the quantity of food that has been grown over two years, between March and October 2019, and March and October 2020. The last two sections of this page are dedicated to transport and the perceived immaterial benefits accrued through gardening. We decided to include transport in these charts because the fuel that is sometimes used for transport adds to the resources used to grow food.
In the last section of the page, two charts show immaterial benefits in terms of motivations for our gardeners to work in this community garden and the impact that this work generates on their health, socialisation and more. Transport, motivations and impacts were identified on the basis of a survey amongst gardeners and volunteers conducted in 2019.
All charts are based on the data that gardeners have collected with much dedication.
WATER
The water chart visualises in two bars the progressive consumption of water and electricity from March to October 2019 and 2020, together with the consumption per meter squared of food production area and kilogram of food harvested. The scale on the vertical axis of each chart shows the overall consumption. The garden is located next to offices and the electricity meter shows the overall consumption of the garden and offices. Electricity consumption of the garden is therefore based on an estimate and includes the energy consumed by the gardeners using facilities of the offices.
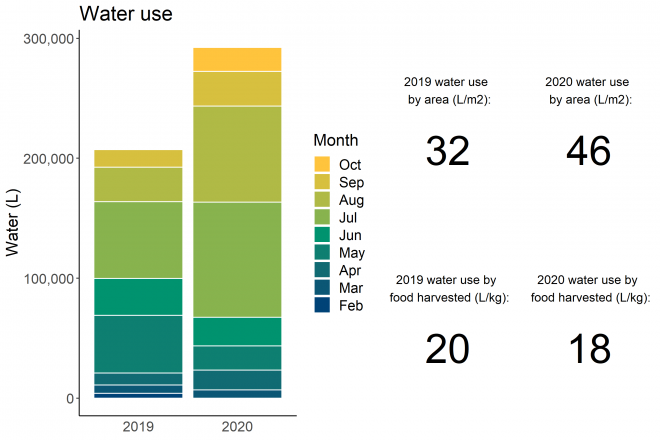
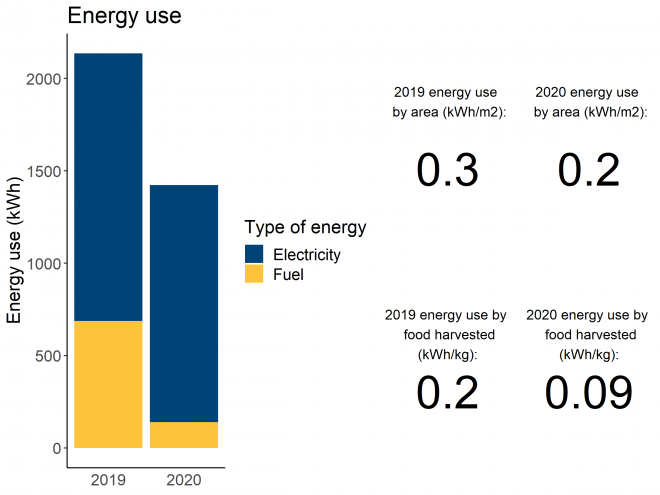
FOOD
The harvest charts, rather than showing harvest per month, show the weight of the crops harvested together with the quantity of kilograms per m2 of food production area, which gives an indication of the intensity of production.
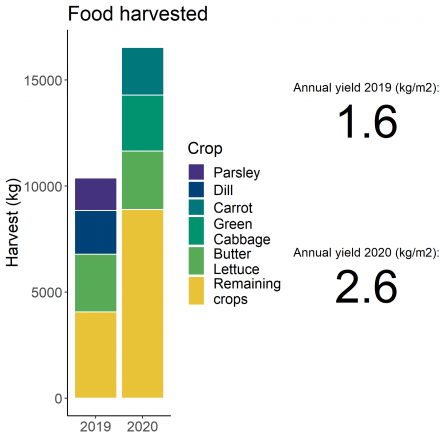
TRANSPORT
We have added a chart for trips to the garden, which in some cases generate a considerable consumption of fuel. This chart, however, needs to be interpreted. For example, in big cities such as New York or London, public transport is sometimes unavoidable and the quantity of kilometres may be also a consequence of the willingness of volunteers who do not live next to the garden to travel long distances. It may also indicate that a particular garden attracts many volunteers. For Polish case studies, commuting to the garden was recorded by only one gardener/plot user, even if the garden/plot was used by other people (e.g. other family members). This chart refers to trips in 2019 and 2020.
![]()
IMPACTS AND MOTIVATIONS
Finally, we have included two charts that show the motivations that most drive volunteers and gardeners to dedicate their time to grow food as well as the related impact on their wellbeing. This chart refers to impacts and motivations recorded in 2019.
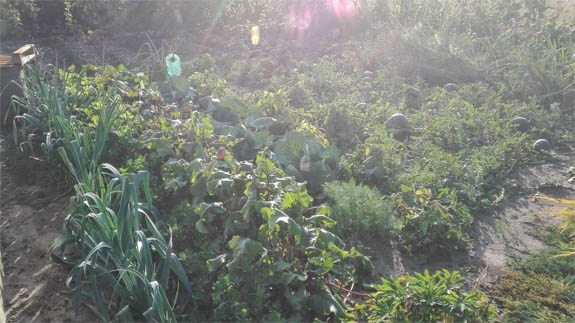
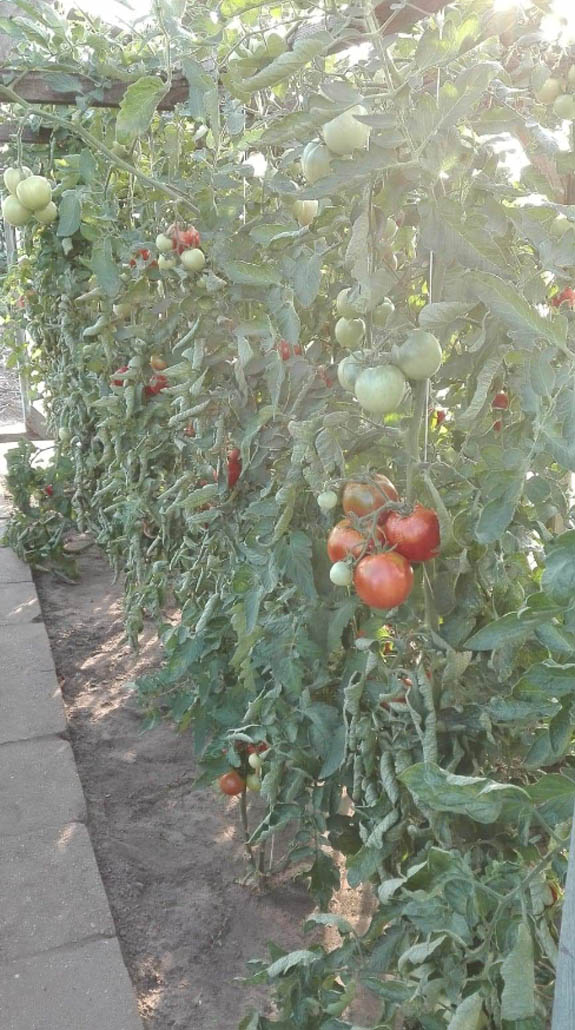
GORZOW 3 is a home garden located in the southern part of Gorzow Wielkopolski. The garden was established in 2005 to provide a family of four with vegetables and fruits. In the area of 880 m2 38 fruit trees of such species as apple, pear, cherry, peach, plum, walnut and hazelnut were planted. The area of 220 m2 is occupied by strawberries and fruit bushes like raspberries, currants (black and red), Kamchatka berries, blueberries, gooseberries, chokeberries, blackberries and grapevines.
Vegetable cultivation is carried out on the area of 200 m2 (including a polytunnel of 13.5 m2 which peppers and tomatoes). The garden owner grows many varieties of vegetables such as carrot, parsley, beetroot, potatoes, leek, celeriac, onion, cabbage, radish, butter lettuce, dill, cucumbers, watermelons, green beans, peas and horseradish.
The majority of harvested vegetables and fruits are intended for the garden owner's family (consumed both fresh and processed, i.e. jams, juices, salads, etc.). Surpluses are transferred to family members and neighbours.
DASHBOARD
The charts included in this ‘dashboard’ show resources that have been used to grow food on the area cultivated with edible crops and the quantity of food that has been grown over two years, between March and October 2019, and March and October 2020. The last two sections of this page are dedicated to transport and the perceived immaterial benefits accrued through gardening. We decided to include transport in these charts because the fuel that is sometimes used for transport adds to the resources used to grow food.
In the last section of the page, two charts show immaterial benefits in terms of motivations for our gardeners to work in this community garden and the impact that this work generates on their health, socialisation and more. Transport, motivations and impacts were identified on the basis of a survey amongst gardeners and volunteers conducted in 2019.
All charts are based on the data that gardeners have collected with much dedication.
WATER
The water chart visualises in two bars the progressive consumption of water and electricity from March to October 2019 and 2020, together with the consumption per meter squared of food production area and kilogram of food harvested. The scale on the vertical axis of each chart shows the overall consumption. The garden is located next to offices and the electricity meter shows the overall consumption of the garden and offices. Electricity consumption of the garden is therefore based on an estimate and includes the energy consumed by the gardeners using facilities of the offices.
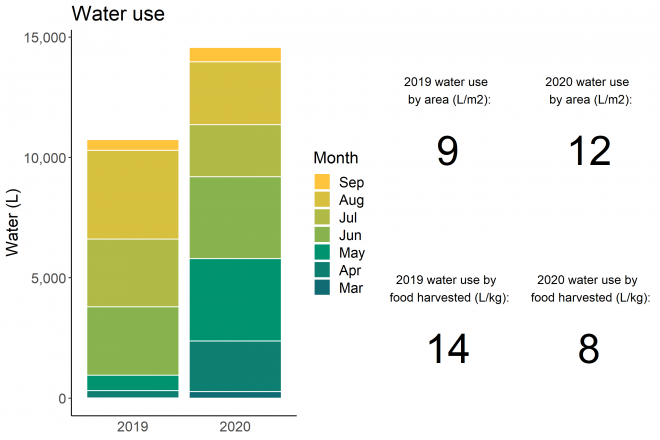
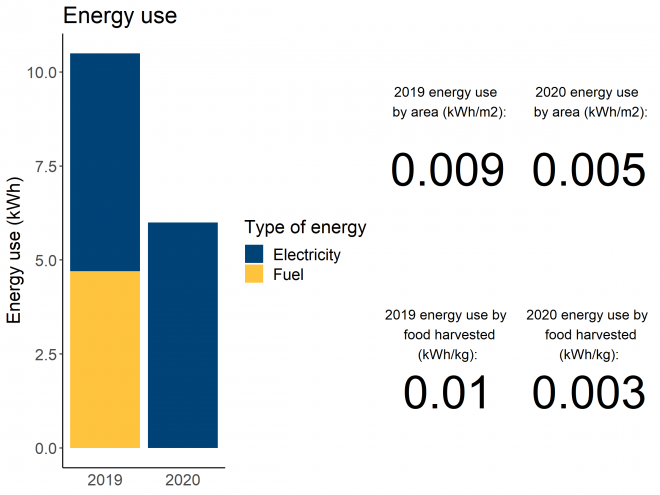
FOOD
The harvest charts, rather than showing harvest per month, show the weight of the crops harvested together with the quantity of kilograms per m2 of food production area, which gives an indication of the intensity of production.
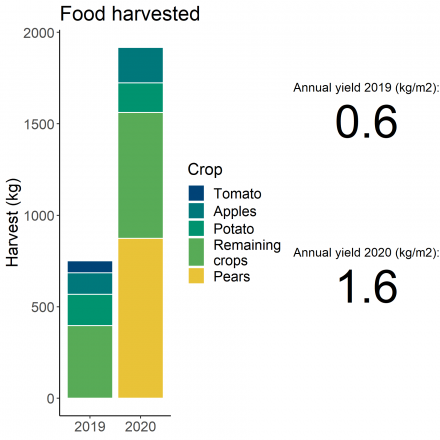
TRANSPORT
We have added a chart for trips to the garden, which in some cases generate a considerable consumption of fuel. This chart, however, needs to be interpreted. For example, in big cities such as New York or London, public transport is sometimes unavoidable and the quantity of kilometres may be also a consequence of the willingness of volunteers who do not live next to the garden to travel long distances. It may also indicate that a particular garden attracts many volunteers. For Polish case studies, commuting to the garden was recorded by only one gardener/plot user, even if the garden/plot was used by other people (e.g. other family members). This chart refers to trips in 2019 and 2020.
IMPACTS AND MOTIVATIONS
Finally, we have included two charts that show the motivations that most drive volunteers and gardeners to dedicate their time to grow food as well as the related impact on their wellbeing. This chart refers to impacts and motivations recorded in 2019.
JEDNOŚĆ 1 - is in Gorzów Wielkopolski, a city with nearly 125,000 inhabitants located in the west of Poland and is an allotment plot within Family Allotment Garden "Jedność", which is associated with Polish Allotment Gardeners Federation, branch of Gorzów Wielkopolski. The allotment garden was established in 1971 and is located in the central part of the city, surrounded by residential areas.
Jedność 1 is one of 118 plots included in the allotment garden. The total area of the case study plot is 405 m2. The current user has been taking care of the plot for 16 years (since 2004). The main benefit of having a plot is the opportunity to rest and recreation, but also to have healthy own fruits and vegetables. Mainly there are grown: tomato, carrot and lettuce.
DASHBOARD
The charts included in this ‘dashboard’ show resources that have been used to grow food on the area cultivated with edible crops and the quantity of food that has been grown over two years, between March and October 2019, and March and October 2020. The last two sections of this page are dedicated to transport and the perceived immaterial benefits accrued through gardening. We decided to include transport in these charts because the fuel that is sometimes used for transport adds to the resources used to grow food.
In the last section of the page, two charts show immaterial benefits in terms of motivations for our gardeners to work in this community garden and the impact that this work generates on their health, socialisation and more. Transport, motivations and impacts were identified on the basis of a survey amongst gardeners and volunteers conducted in 2019.
All charts are based on the data that gardeners have collected with much dedication.
WATER
The water chart visualises in two bars the progressive consumption of water and electricity from March to October 2019 and 2020, together with the consumption per meter squared of food production area and kilogram of food harvested. The scale on the vertical axis of each chart shows the overall consumption. The garden is located next to offices and the electricity meter shows the overall consumption of the garden and offices. Electricity consumption of the garden is therefore based on an estimate and includes the energy consumed by the gardeners using facilities of the offices.
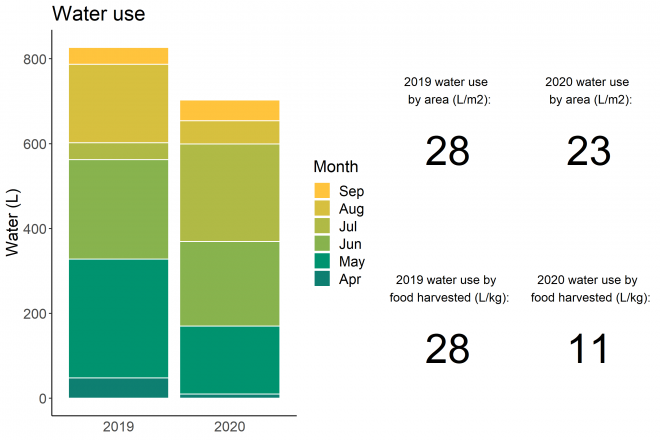
FOOD
The harvest charts, rather than showing harvest per month, show the weight of the crops harvested together with the quantity of kilograms per m2 of food production area, which gives an indication of the intensity of production.
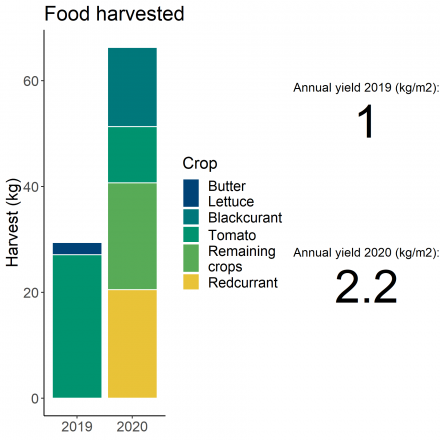
TRANSPORT
We have added a chart for trips to the garden, which in some cases generate a considerable consumption of fuel. This chart, however, needs to be interpreted. For example, in big cities such as New York or London, public transport is sometimes unavoidable and the quantity of kilometres may be also a consequence of the willingness of volunteers who do not live next to the garden to travel long distances. It may also indicate that a particular garden attracts many volunteers. For Polish case studies, commuting to the garden was recorded by only one gardener/plot user, even if the garden/plot was used by other people (e.g. other family members). This chart refers to trips in 2019 and 2020.
![]()
IMPACTS AND MOTIVATIONS
Finally, we have included two charts that show the motivations that most drive volunteers and gardeners to dedicate their time to grow food as well as the related impact on their wellbeing. This chart refers to impacts and motivations recorded in 2019.
JEDNOŚĆ 3 - is in Gorzów Wielkopolski, a city with nearly 125,000 inhabitants located in the west of Poland and is an allotment plot within Family Allotment Garden "Jedność", which is associated with Polish Allotment Gardeners Federation, branch of Gorzów Wielkopolski. The allotment garden was established in 1971 and is located in the central part of the city, surrounded by residential areas.
Jedność 3 is one of 118 plots included in the allotment garden. The total area of the case study plot is 396 m2. The current user has been taking care of the plot for 10 years (since 2010). The main benefit of having a plot is the opportunity to rest and recreation, but also to have healthy own fruits and vegetables. Mainly there are grown: cucumber, beetroot, lettuce and leek.
DASHBOARD
The charts included in this ‘dashboard’ show resources that have been used to grow food on the area cultivated with edible crops and the quantity of food that has been grown over two years, between March and October 2019, and March and October 2020. The last two sections of this page are dedicated to transport and the perceived immaterial benefits accrued through gardening. We decided to include transport in these charts because the fuel that is sometimes used for transport adds to the resources used to grow food.
In the last section of the page, two charts show immaterial benefits in terms of motivations for our gardeners to work in this community garden and the impact that this work generates on their health, socialisation and more. Transport, motivations and impacts were identified on the basis of a survey amongst gardeners and volunteers conducted in 2019.
All charts are based on the data that gardeners have collected with much dedication.
WATER
The water chart visualises in two bars the progressive consumption of water and electricity from March to October 2019 and 2020, together with the consumption per meter squared of food production area and kilogram of food harvested. The scale on the vertical axis of each chart shows the overall consumption. The garden is located next to offices and the electricity meter shows the overall consumption of the garden and offices. Electricity consumption of the garden is therefore based on an estimate and includes the energy consumed by the gardeners using facilities of the offices.
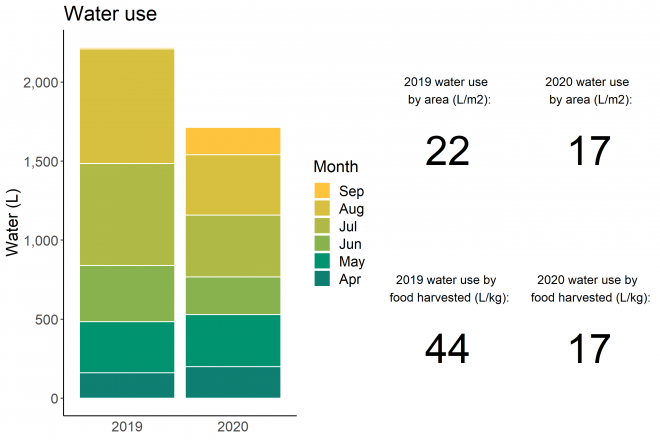
FOOD
The harvest charts, rather than showing harvest per month, show the weight of the crops harvested together with the quantity of kilograms per m2 of food production area, which gives an indication of the intensity of production.
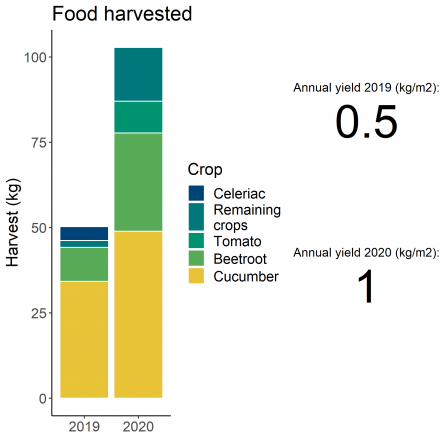
TRANSPORT
We have added a chart for trips to the garden, which in some cases generate a considerable consumption of fuel. This chart, however, needs to be interpreted. For example, in big cities such as New York or London, public transport is sometimes unavoidable and the quantity of kilometres may be also a consequence of the willingness of volunteers who do not live next to the garden to travel long distances. It may also indicate that a particular garden attracts many volunteers. For Polish case studies, commuting to the garden was recorded by only one gardener/plot user, even if the garden/plot was used by other people (e.g. other family members). This chart refers to trips in 2019 and 2020.
![]()
IMPACTS AND MOTIVATIONS
Finally, we have included two charts that show the motivations that most drive volunteers and gardeners to dedicate their time to grow food as well as the related impact on their wellbeing. This chart refers to impacts and motivations recorded in 2019.
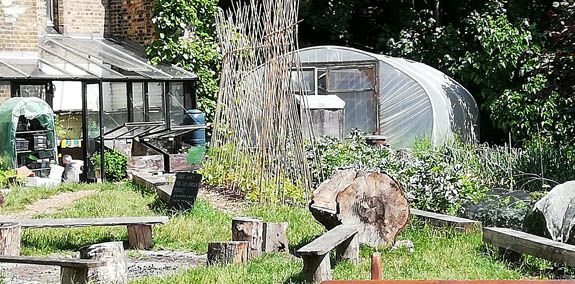
DASHBOARD
The charts included in this ‘dashboard’ show resources that have been used to grow food on the area cultivated with edible crops, the quantity of food that has been grown and the perceived immaterial benefits accrued through gardening, between March and October 2019. Charts are based on the data that gardeners have collected with much dedication.
WATER
The water chart visualises in a bar the progressive consumption of water and electricity across some months of the year, together with the consumption per meter squared of food production area and kilogram of food harvested. The scale on the vertical axis of each chart shows the overall consumption. The garden is located next to offices and the electricity meter shows the overall consumption of the garden and offices. Electricity consumption of the garden is therefore based on an estimate and includes the energy consumed by the gardeners using facilities of the offices.

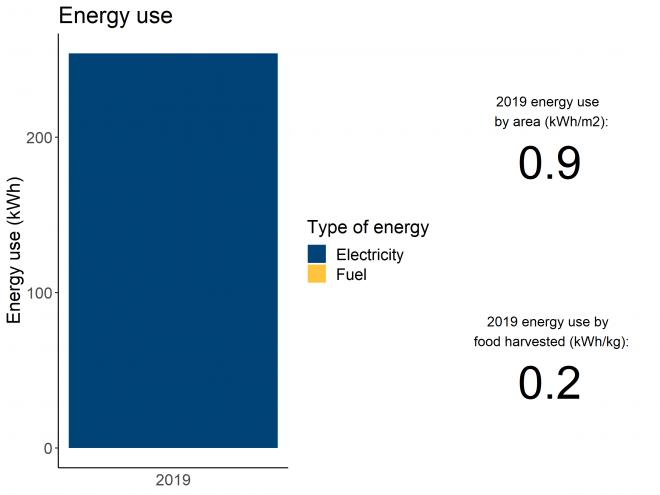
FOOD
The harvest chart, rather than showing harvest per month, shows the weight of the crops that were picked together with the quantity of kilograms per meter squared of food production area, which gives an indication of the intensity of production.
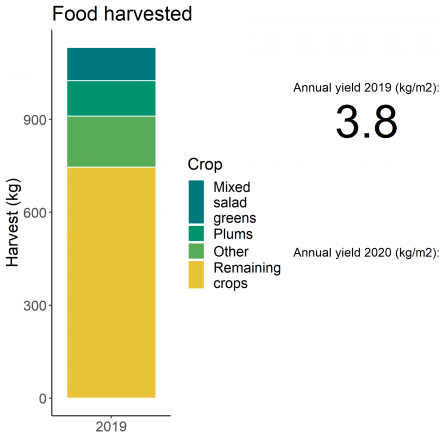
TRANSPORT
We have added a chart for trips to the garden, which is some cases generate a considerable consumption of fuel. This chart, however, needs to be interpreted. For example, in big cities such as New York or London, public transport is sometimes unavoidable and the quantity of kilometres may be also a consequence of the willingness of volunteers who do not live next to the garden to travel long distances. It may also indicate that a particular garden attracts many volunteers.
![]()
IMPACTS AND MOTIVATIONS
Finally, we have included two charts that show the motivations that most drive volunteers and gardeners to dedicate their time to grow food as well as the related impact on their wellbeing.
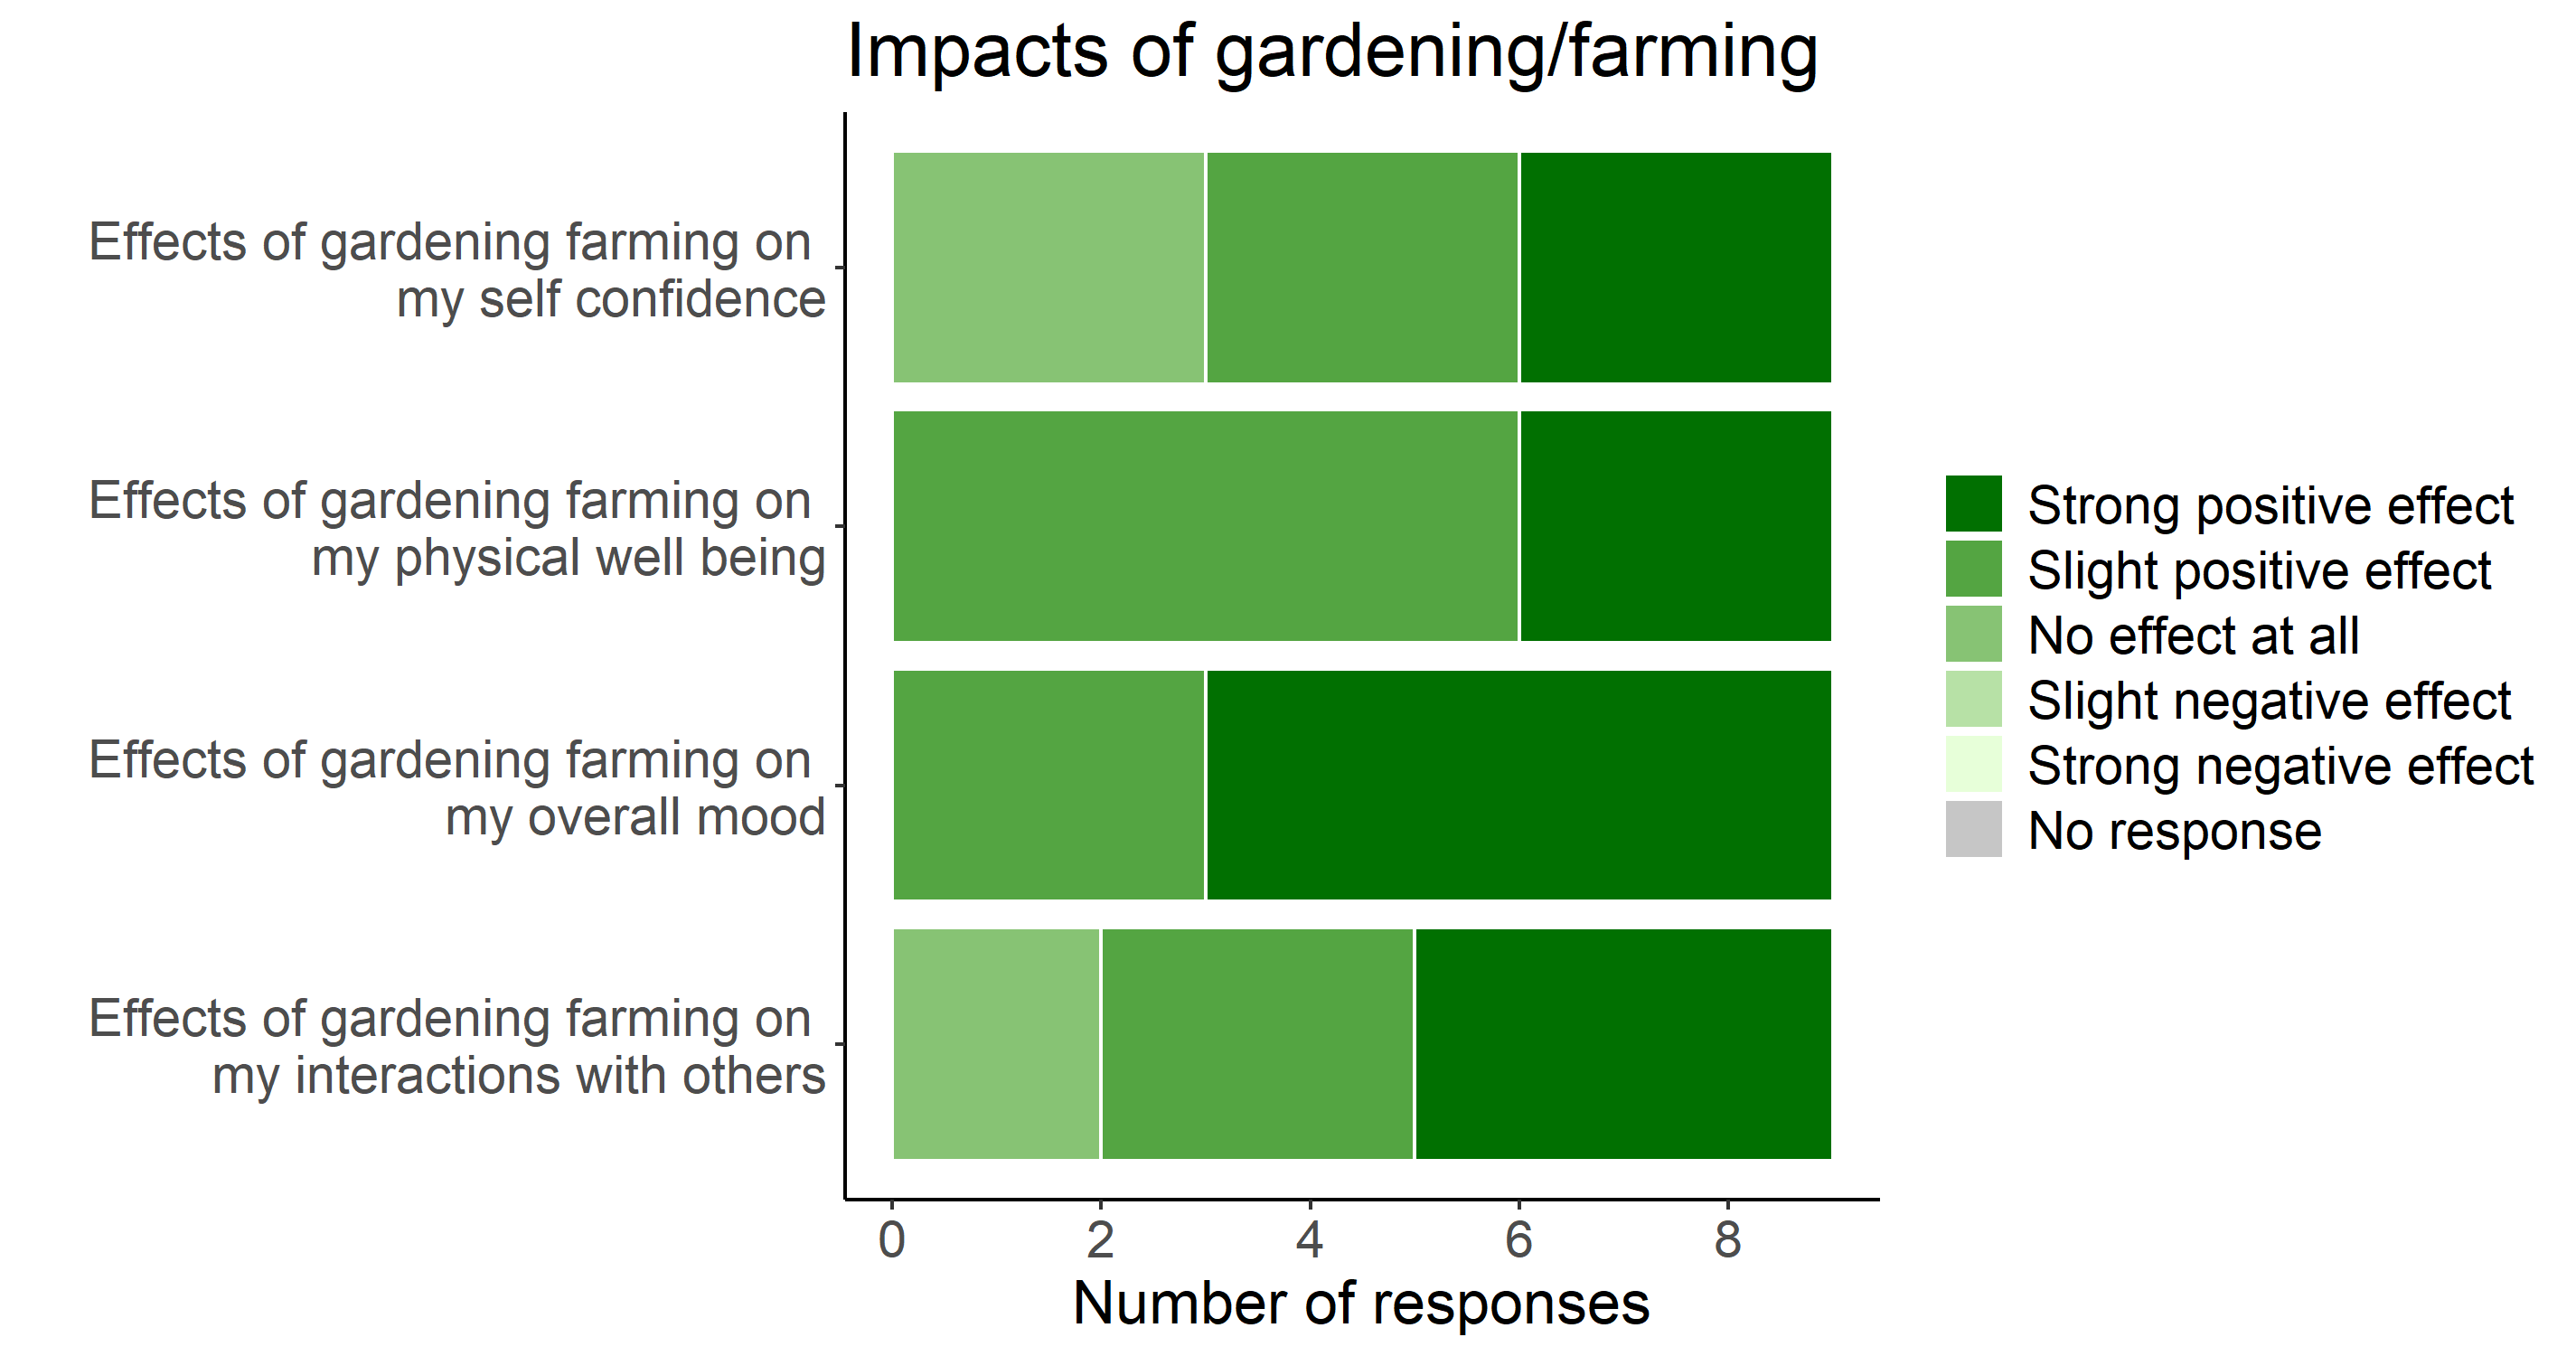
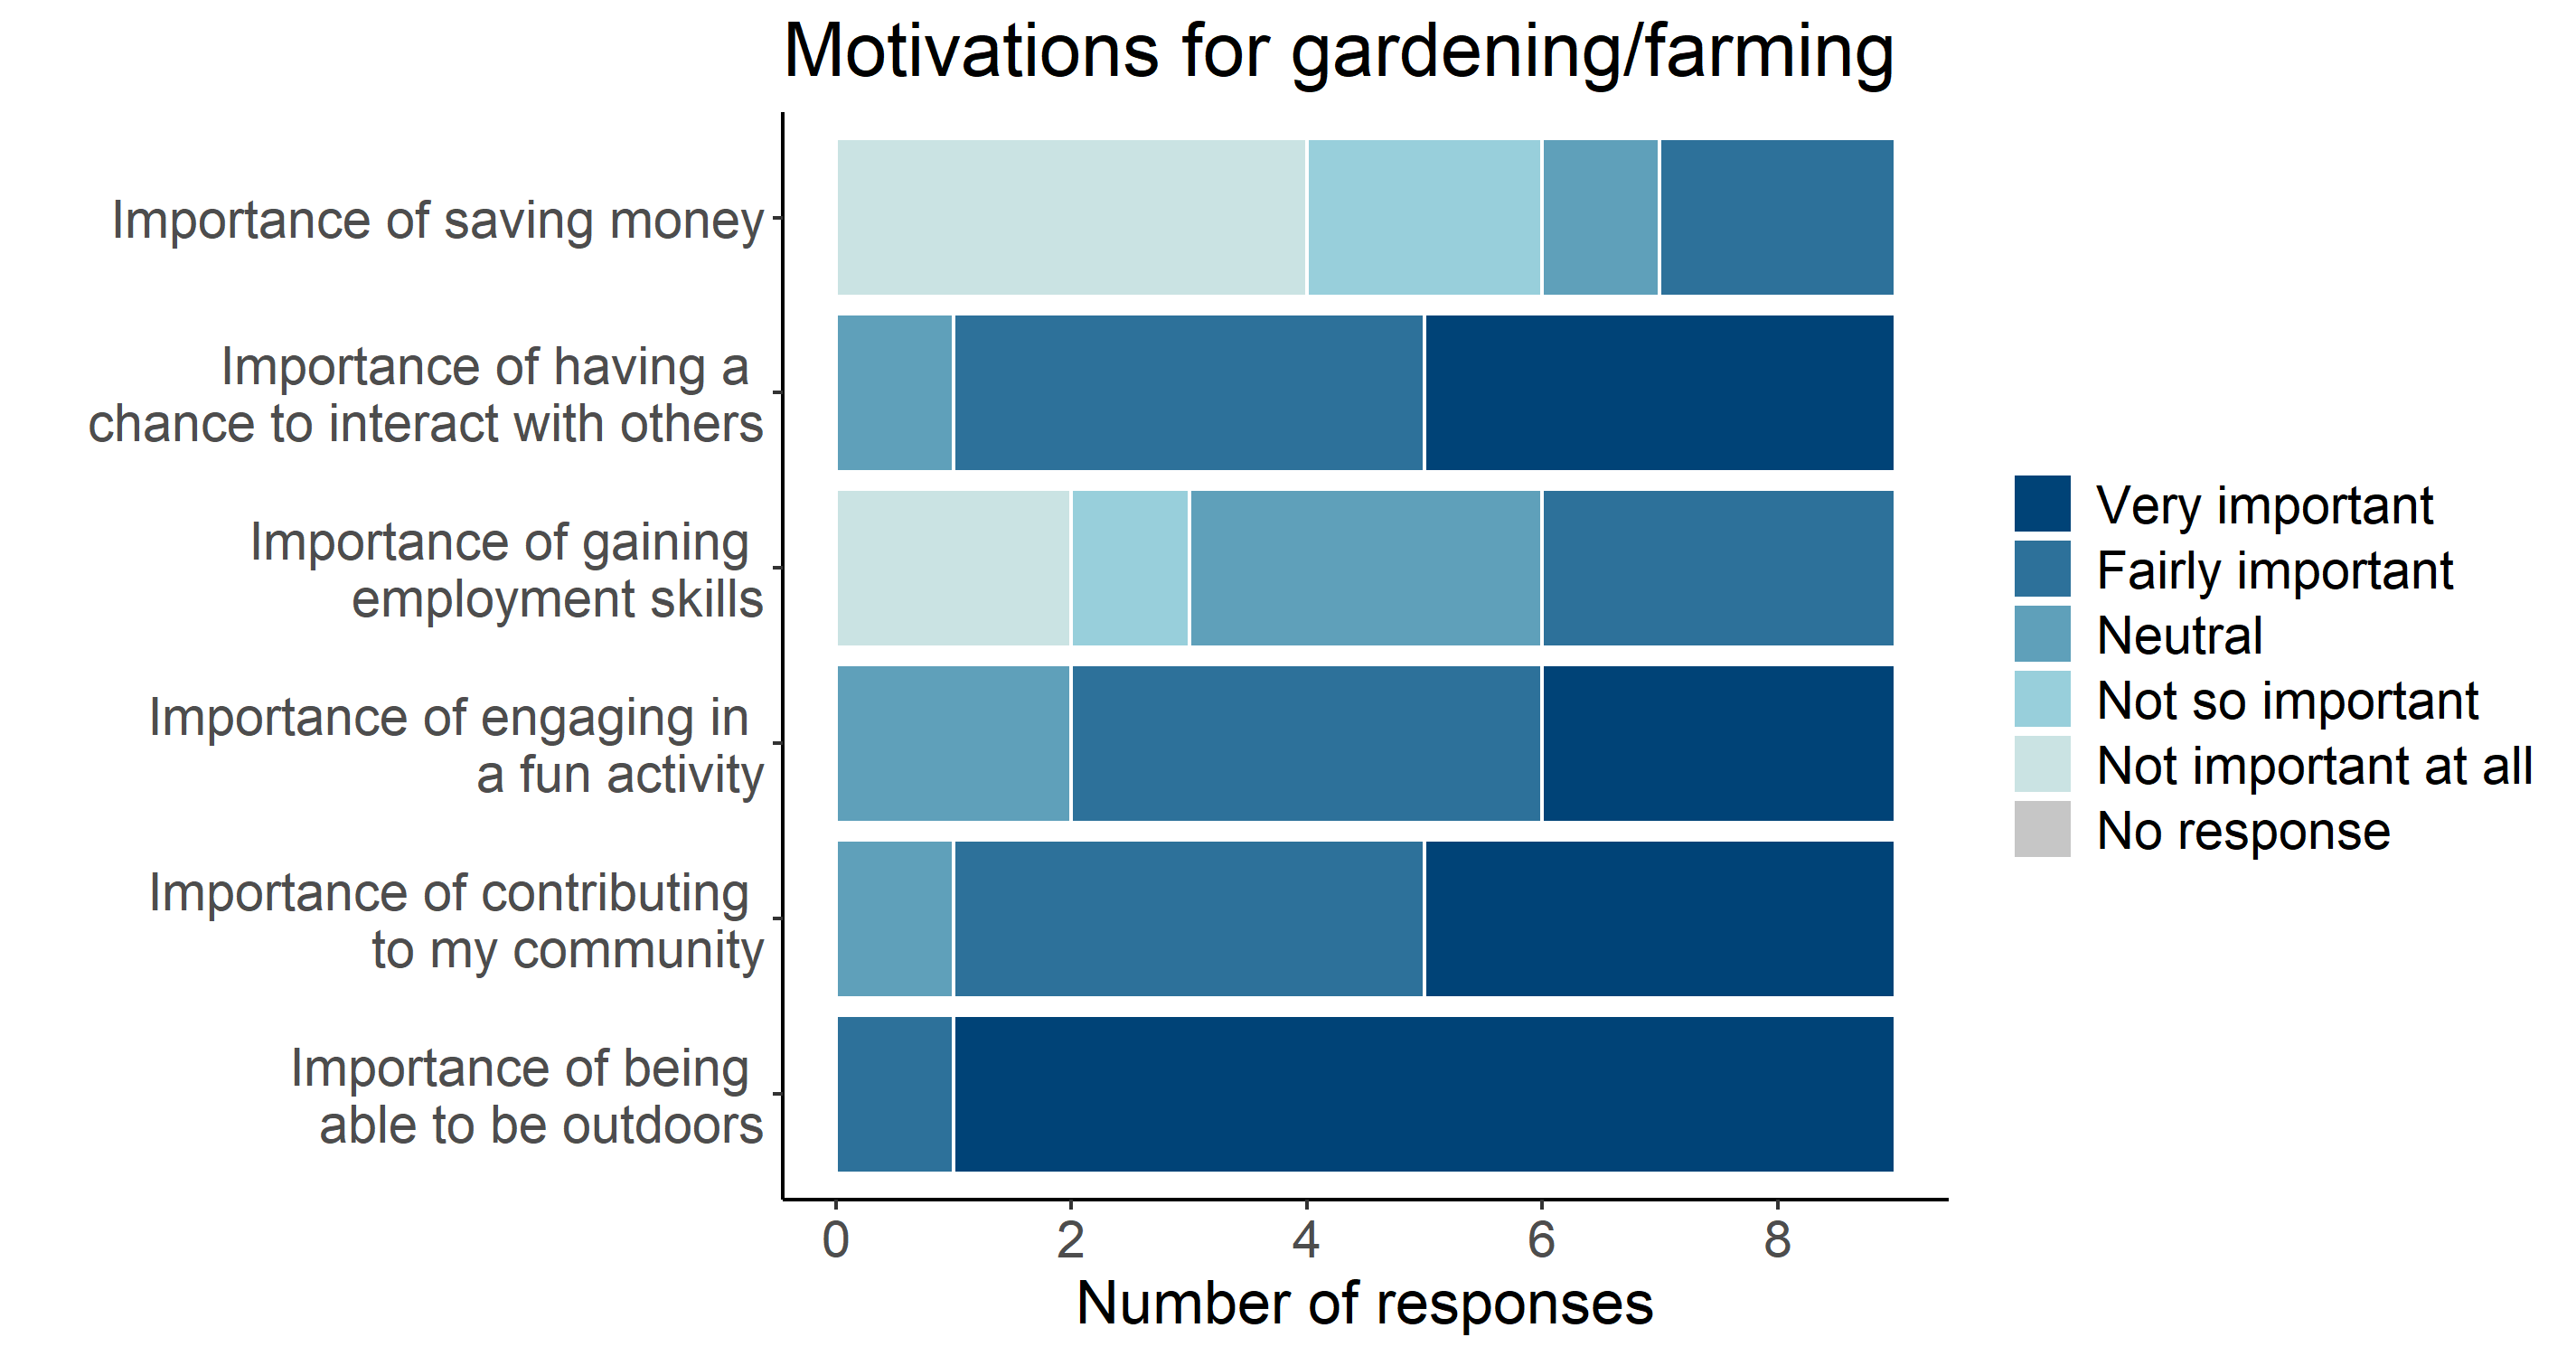
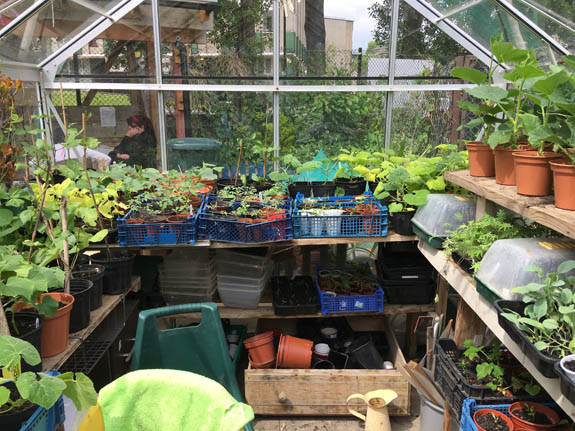
DASHBOARD
The charts included in this ‘dashboard’ show resources that have been used to grow food on the area cultivated with edible crops and the quantity of food that has been grown over two years, between March and October 2019, and March and October 2020. The last two sections of this page are dedicated to transport and the perceived immaterial benefits accrued through gardening. We decided to include transport in these charts because the fuel that is sometimes used for transport adds to the resources used to grow food.
In the last section of the page, two charts show immaterial benefits in terms of motivations for our gardeners to work in this community garden and the impact that this work generates on their health, socialisation and more. Transport, motivations and impacts were identified on the basis of a survey amongst gardeners and volunteers conducted in 2019.
All charts are based on the data that gardeners have collected with much dedication.
WATER
The water chart visualises in two bars the progressive consumption of water and electricity from March to October 2019 and 2020, together with the consumption per meter squared of food production area and kilogram of food harvested. The scale on the vertical axis of each chart shows the overall consumption. The garden is located next to offices and the electricity meter shows the overall consumption of the garden and offices. Electricity consumption of the garden is therefore based on an estimate and includes the energy consumed by the gardeners using facilities of the offices.
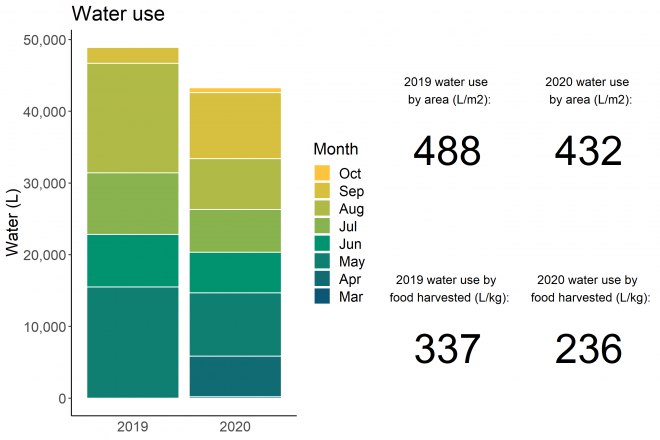

FOOD
The harvest charts, rather than showing harvest per month, show the weight of the crops harvested together with the quantity of kilograms per m2 of food production area, which gives an indication of the intensity of production.
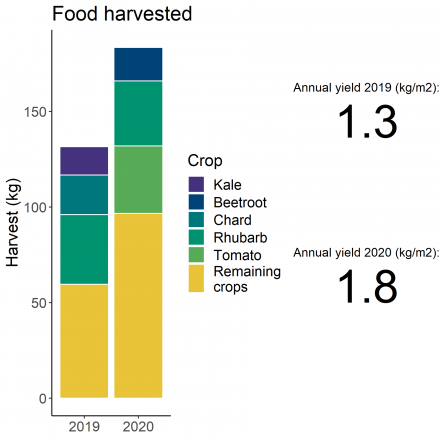
TRANSPORT
We have added a chart for trips to the garden, which is some cases generate a considerable consumption of fuel. This chart, however, needs to be interpreted. For example, in big cities such as New York or London, public transport is sometimes unavoidable and the number of kilometres may be also a consequence of the willingness of volunteers who do not live next to the garden to travel long distances. It may also indicate that a particular garden attracts many volunteers. This chart refers to trips in 2019.
![]()
IMPACTS AND MOTIVATIONS
Finally, we have included two charts that show the motivations that most drive volunteers and gardeners to dedicate their time to grow food as well as the related impact on their wellbeing. This chart refers to impacts and motivations recorded in 2019.
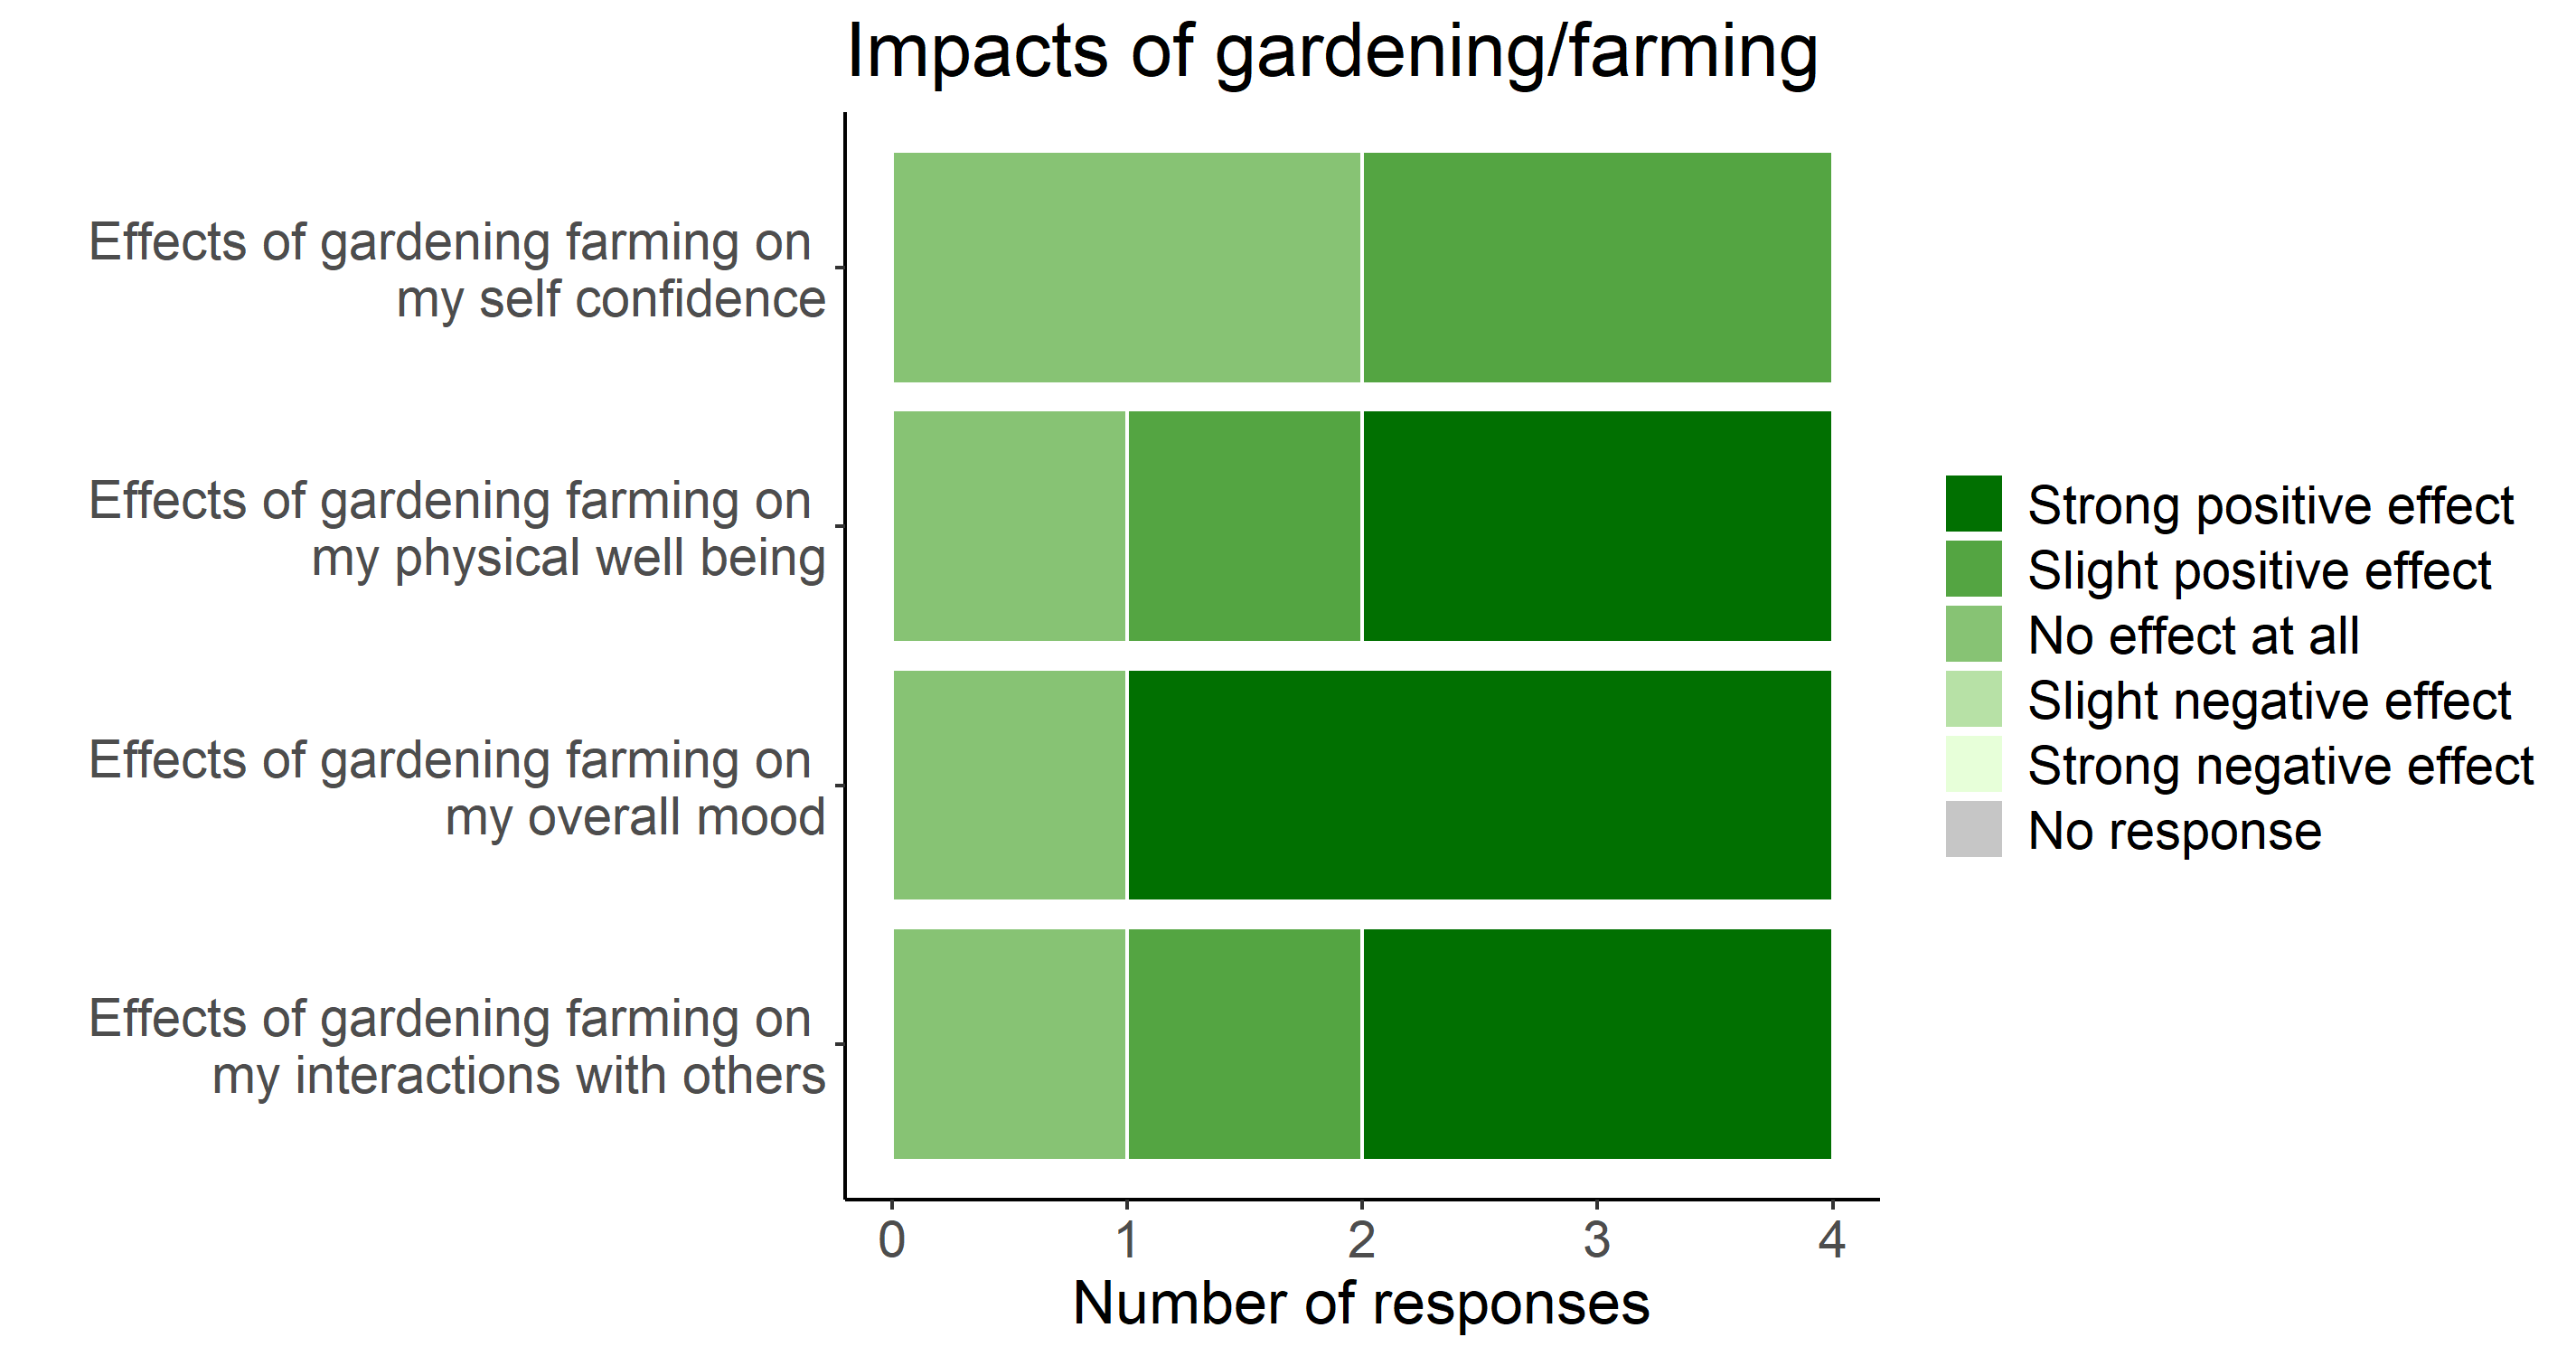
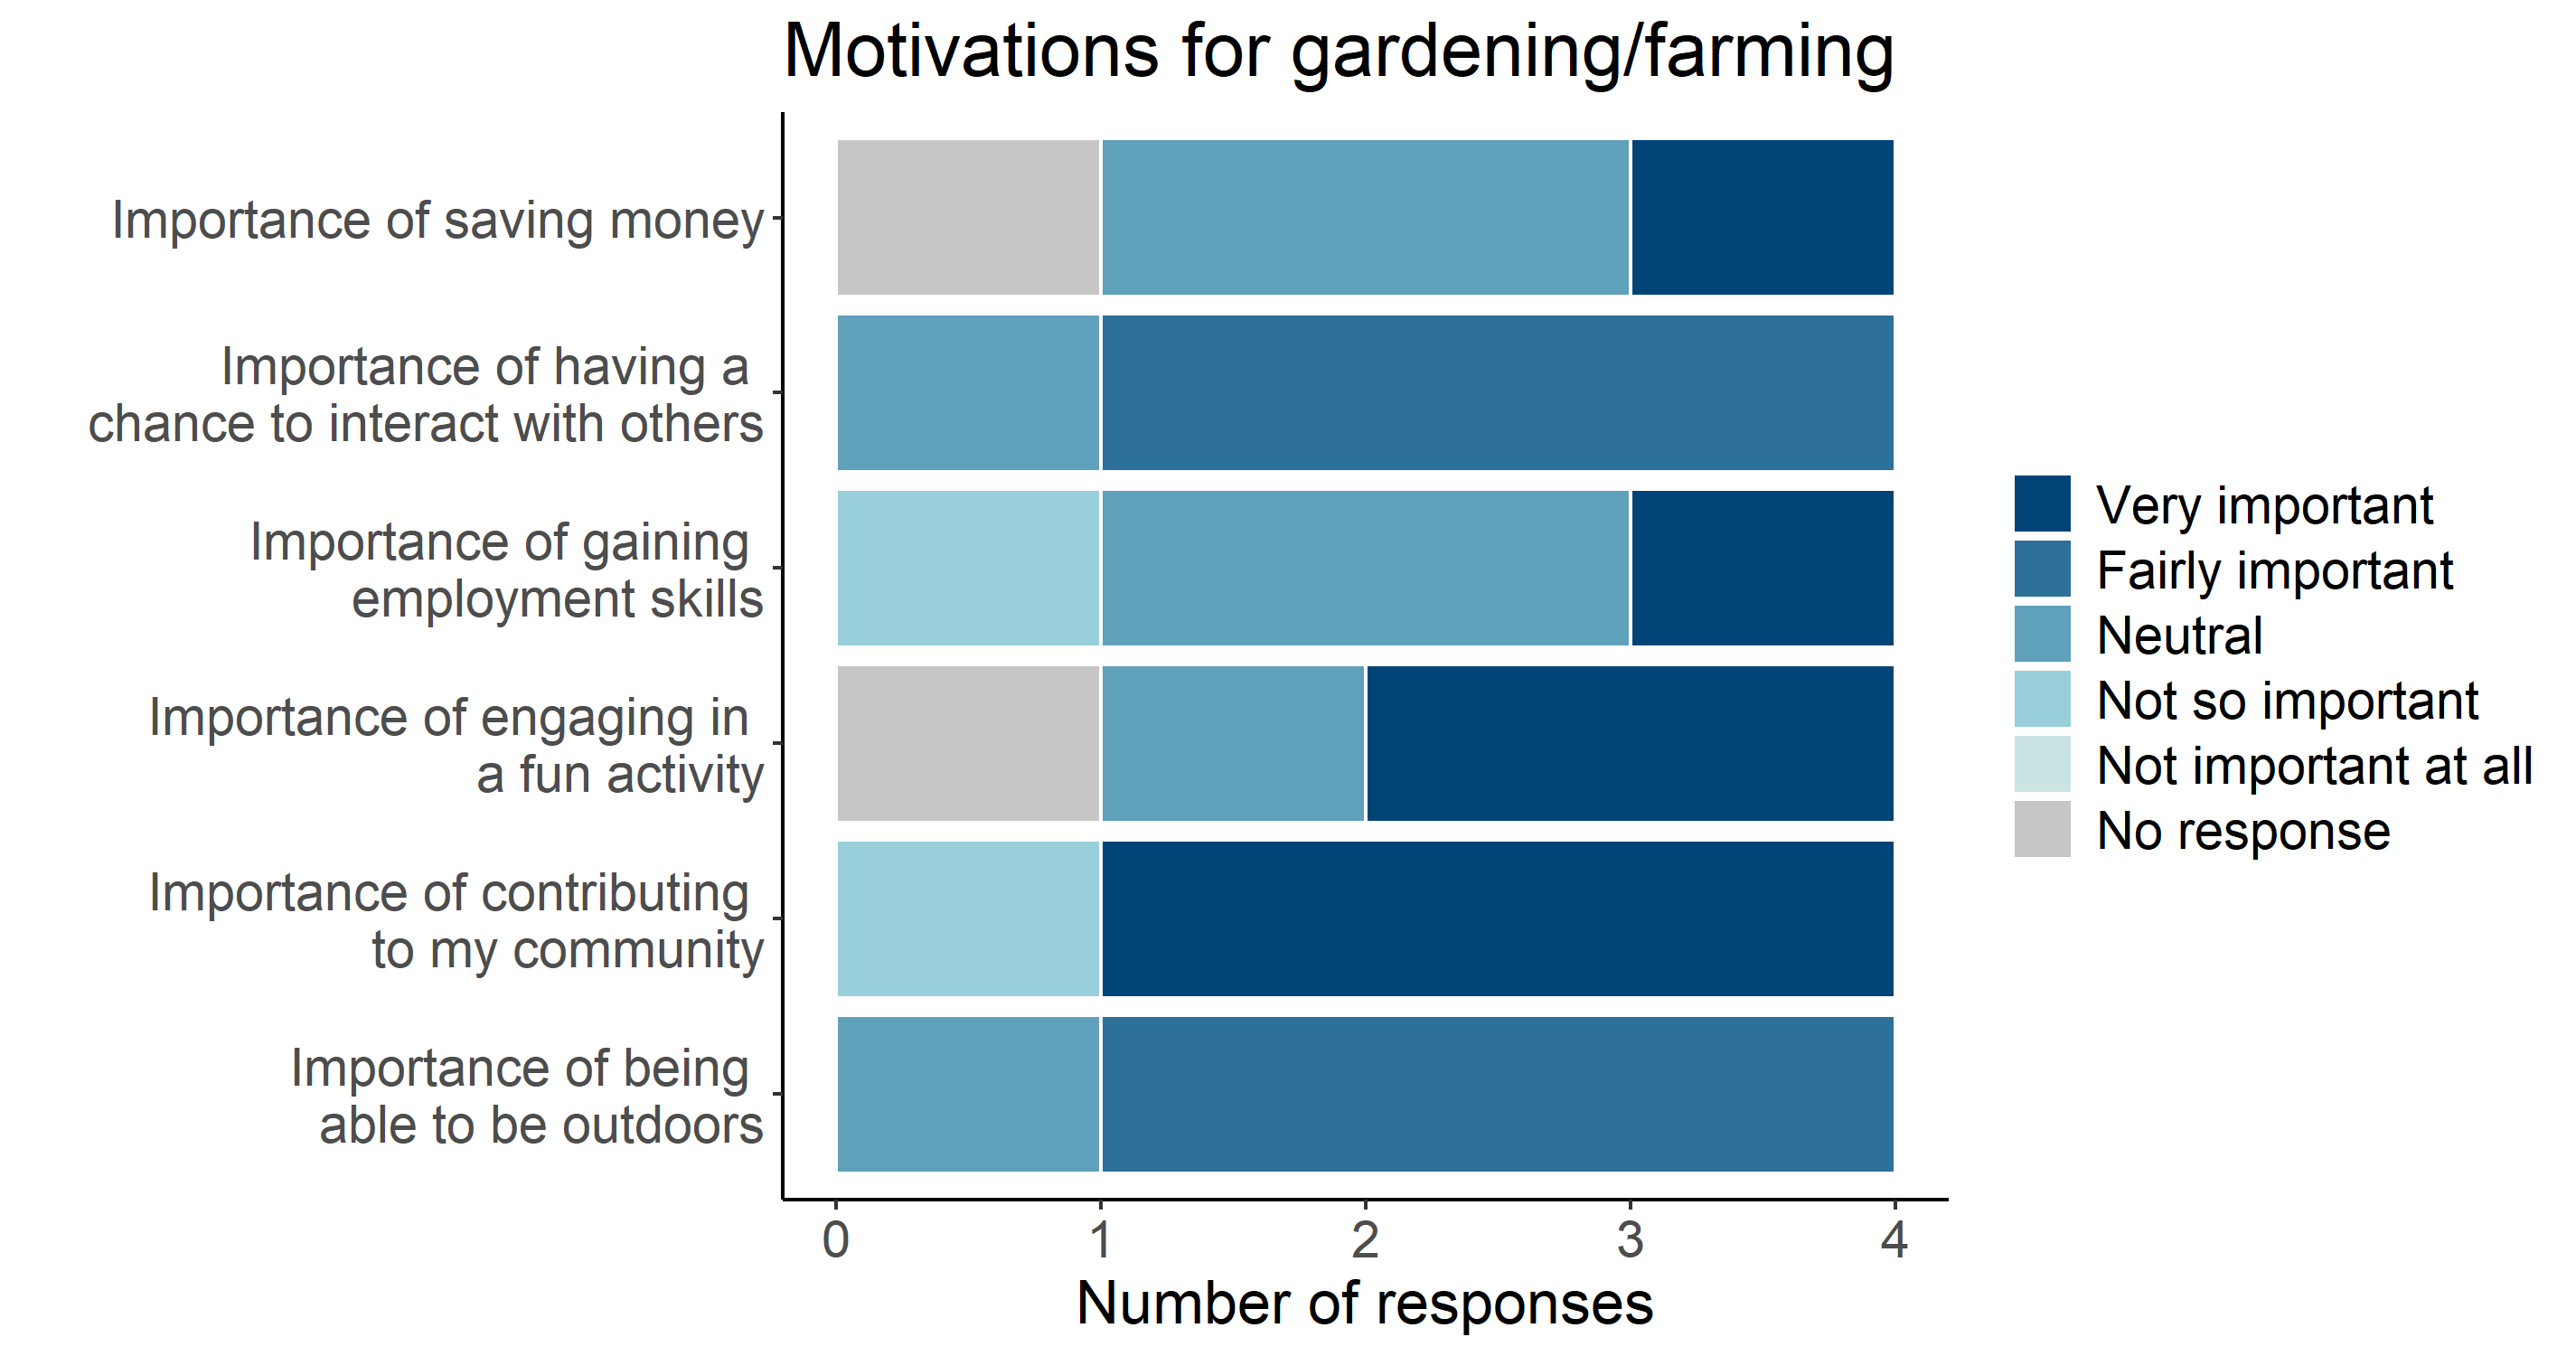
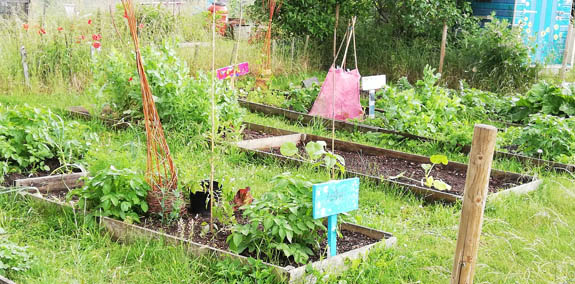
DASHBOARD
The charts included in this ‘dashboard’ show resources that have been used to grow food on the area cultivated with edible crops and the quantity of food that has been grown over two years, between March and October 2019, and March and October 2020. The last two sections of this page are dedicated to transport and the perceived immaterial benefits accrued through gardening. We decided to include transport in these charts because the fuel that is sometimes used for transport adds to the resources used to grow food.
In the last section of the page, two charts show immaterial benefits in terms of motivations for our gardeners to work in this community garden and the impact that this work generates on their health, socialisation and more. Transport, motivations and impacts were identified on the basis of a survey amongst gardeners and volunteers conducted in 2019.
All charts are based on the data that gardeners have collected with much dedication.
WATER
The water chart visualises the progressive consumption of water from March to October 2019 and 2020, together with the consumption per meter squared of food production area and kilogram of food harvested. The scale on the vertical axis shows the overall consumption.
Gardeners use some electricity for their activities but this is generated by photo-voltaic panels installed on the roof of the community hub. Therefore there is no real electricity consumption.
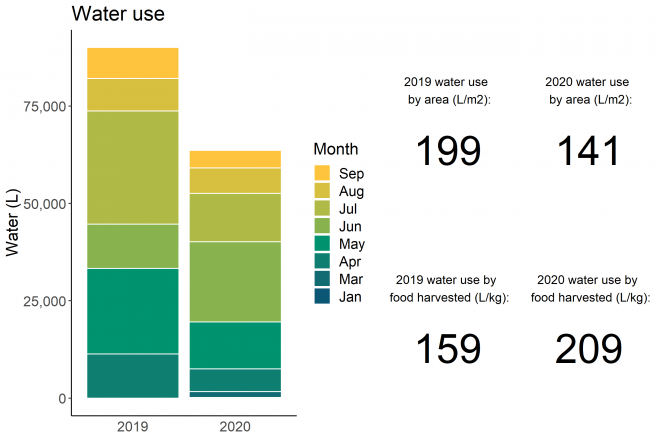
FOOD
The harvest charts, rather than showing harvest per month, show the weight of the crops harvested together with the quantity of kilograms per m2 of food production area, which gives an indication of the intensity of production.
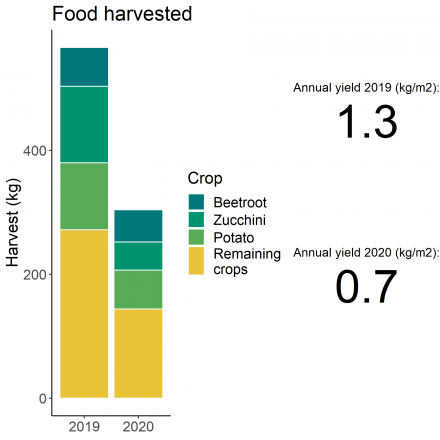
TRANSPORT
We have added a chart for trips to the garden, which is some cases generate a considerable consumption of fuel. This chart, however, needs to be interpreted. For example, in big cities such as New York or London, public transport is sometimes unavoidable and the number of kilometres may be also a consequence of the willingness of volunteers who do not live next to the garden to travel long distances. It may also indicate that a particular garden attracts many volunteers. This chart refers to trips in 2019.
![]()
IMPACTS AND MOTIVATIONS
Finally, we have included two charts that show the motivations that most drive volunteers and gardeners to dedicate their time to grow food as well as the related impact on their wellbeing. This chart refers to impacts and motivations recorded in 2019.
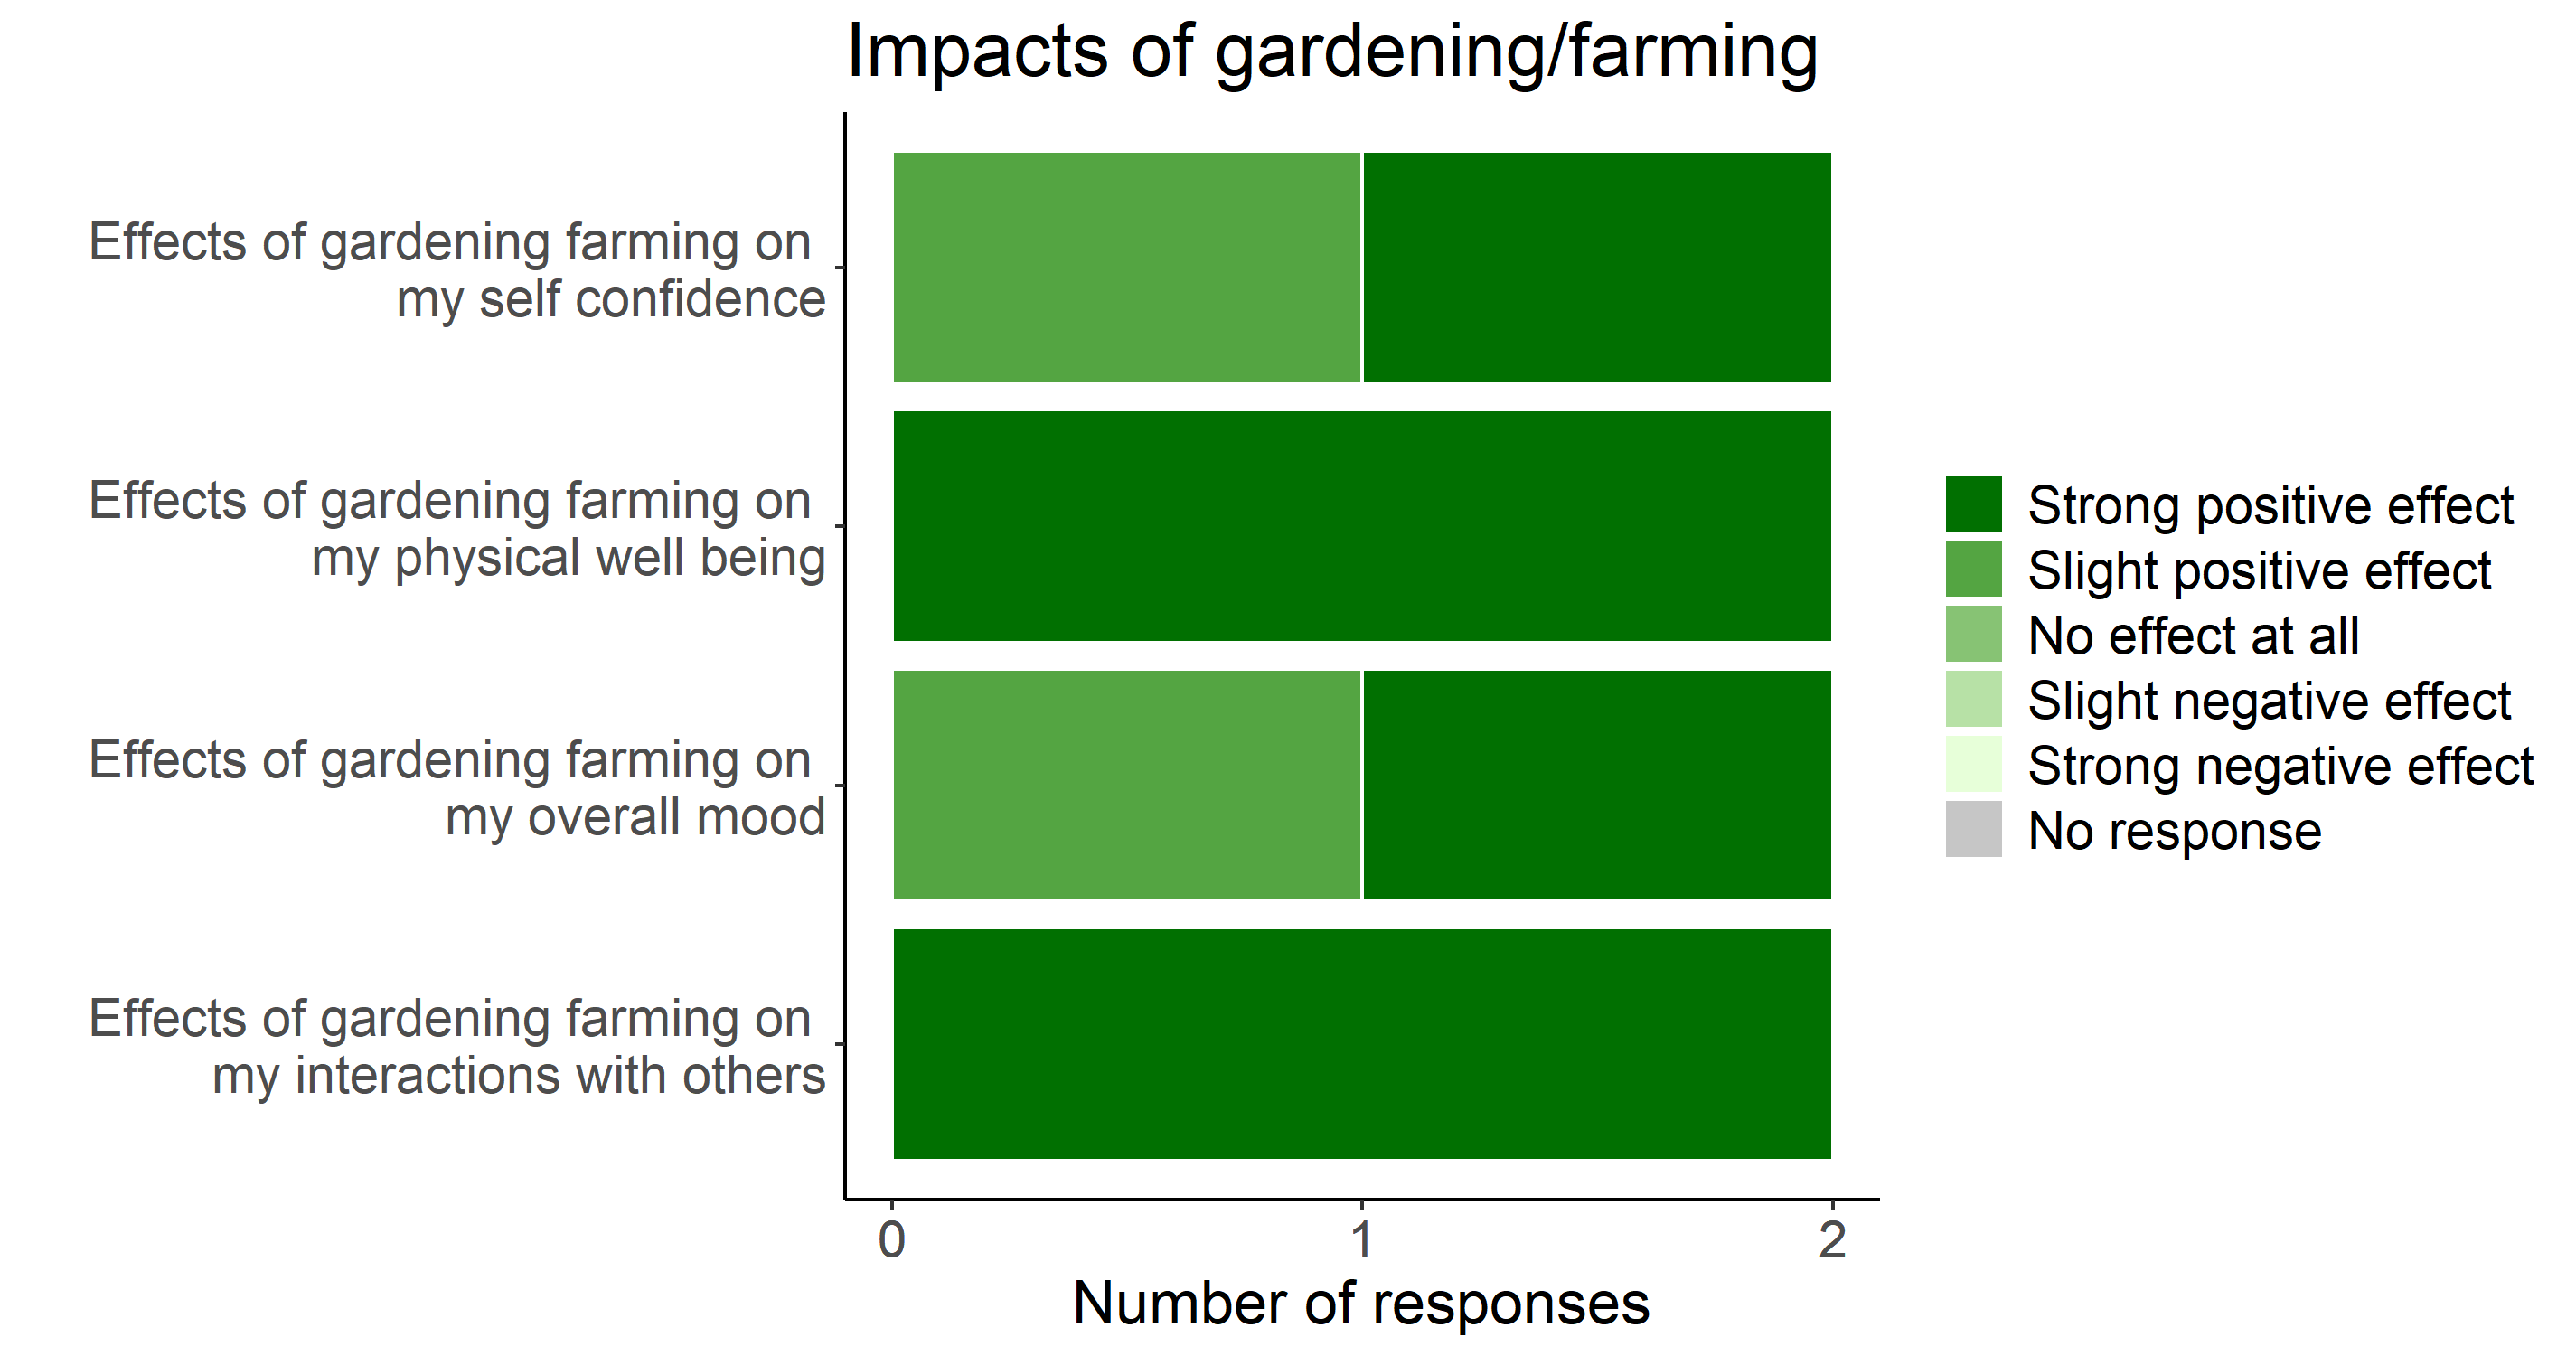
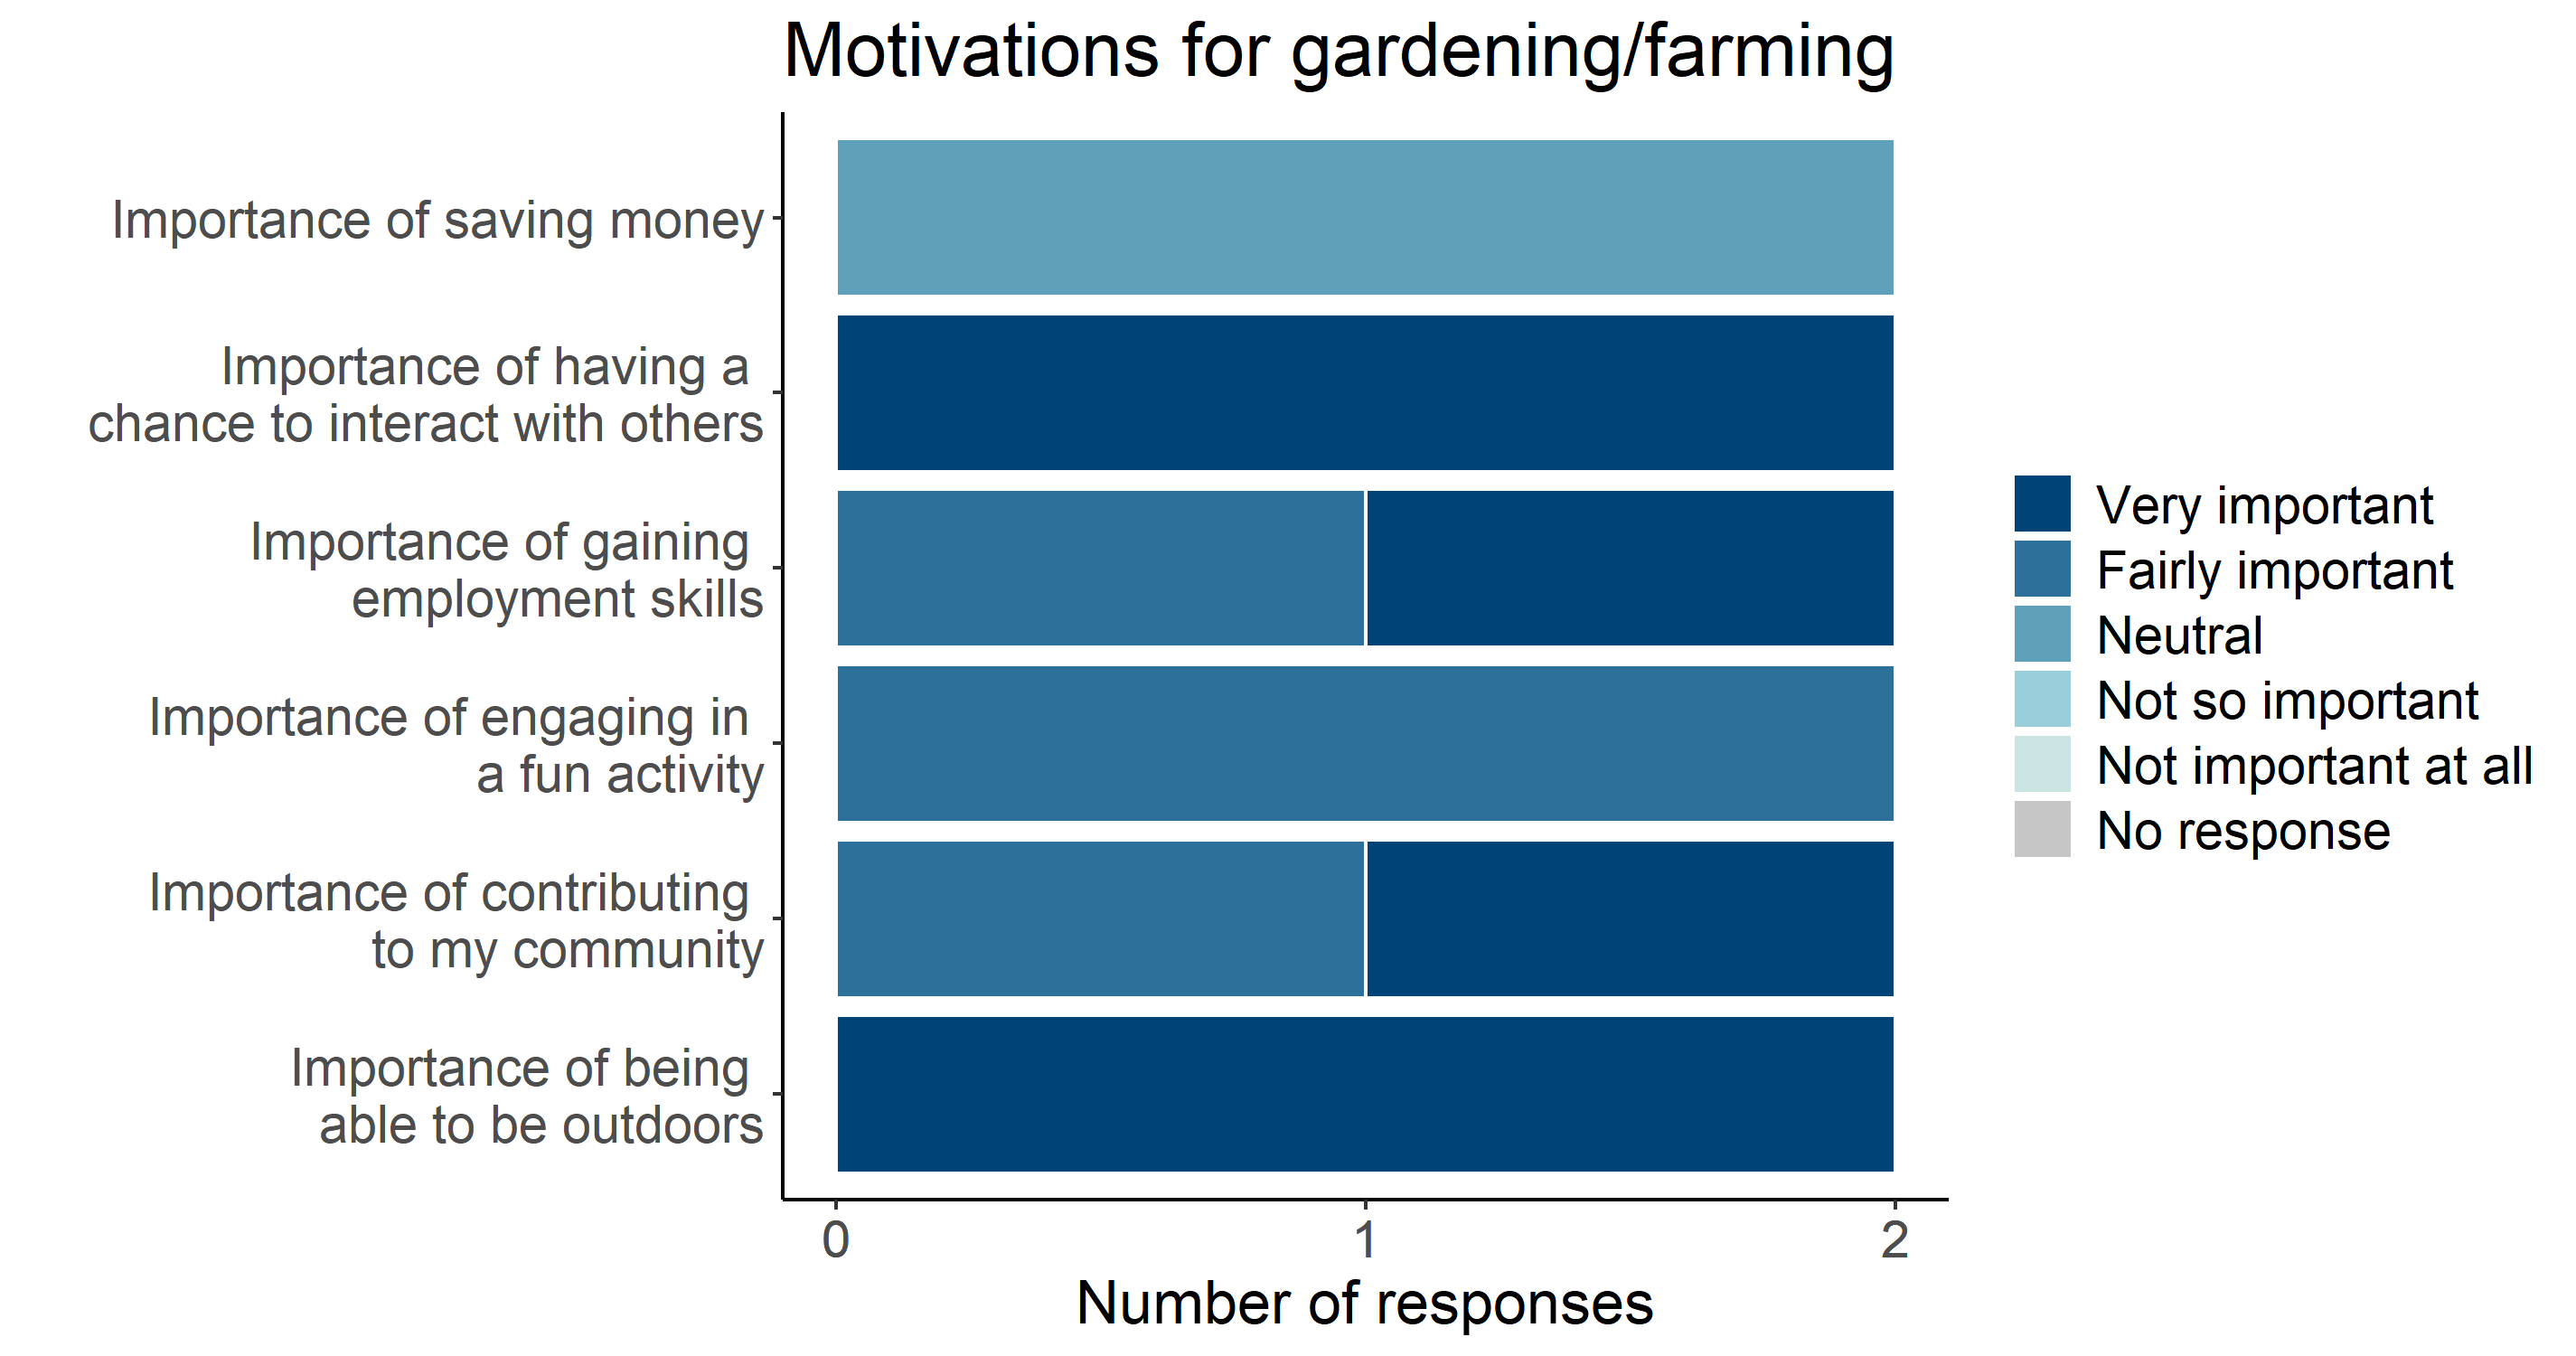
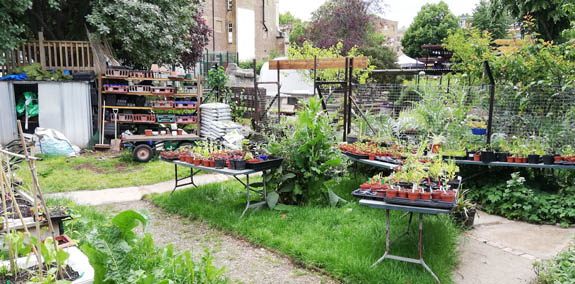
DASHBOARD
The charts included in this ‘dashboard’ show resources that have been used to grow food on the area cultivated with edible crops and the quantity of food that has been grown over two years, between March and October 2019, and March and October 2020. The last two sections of this page are dedicated to transport and the perceived immaterial benefits accrued through gardening. We decided to include transport in these charts because the fuel that is sometimes used for transport adds to the resources used to grow food.
In the last section of the page, two charts show immaterial benefits in terms of motivations for our gardeners to work in this community garden and the impact that this work generates on their health, socialisation and more. Transport, motivations and impacts were identified on the basis of a survey amongst gardeners and volunteers conducted in 2019.
All charts are based on the data that gardeners have collected with much dedication.
WATER
The water chart visualises in two bars the progressive consumption of water and electricity from March to October 2019 and 2020, together with the consumption per meter squared of food production area and kilogram of food harvested. The scale on the vertical axis of each chart shows the overall consumption. The garden is located next to offices and the electricity meter shows the overall consumption of the garden and offices. Electricity consumption of the garden is therefore based on an estimate and includes the energy consumed by the gardeners using facilities of the offices.
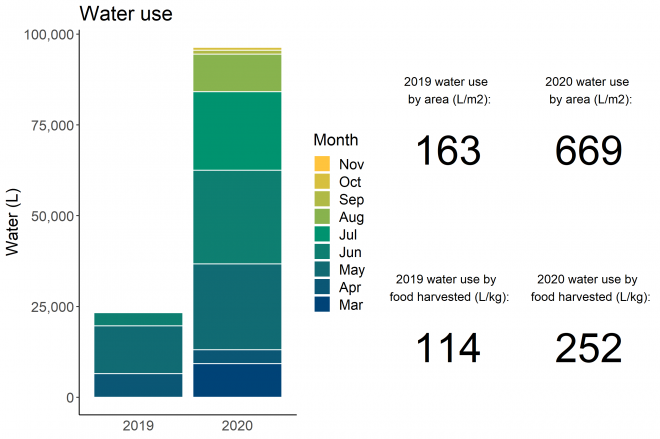
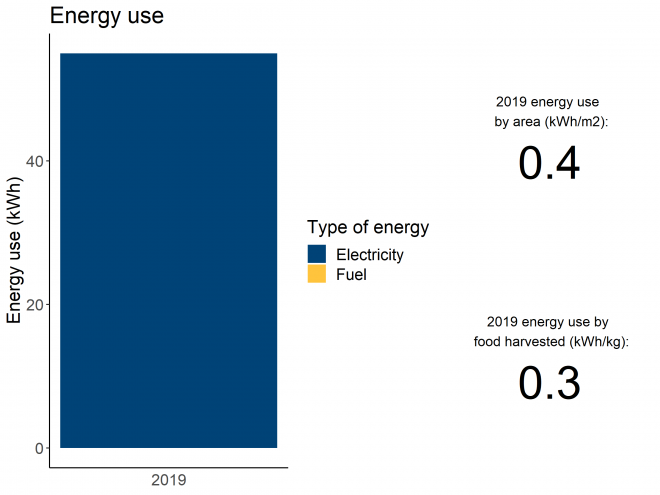
FOOD
The harvest charts, rather than showing harvest per month, show the weight of the crops harvested together with the quantity of kilograms per m2 of food production area, which gives an indication of the intensity of production.
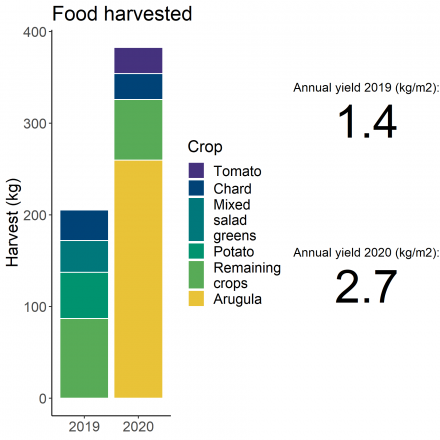
TRANSPORT
We have added a chart for trips to the garden, which is some cases generate a considerable consumption of fuel. This chart, however, needs to be interpreted. For example, in big cities such as New York or London, public transport is sometimes unavoidable and the number of kilometres may be also a consequence of the willingness of volunteers who do not live next to the garden to travel long distances. It may also indicate that a particular garden attracts many volunteers. This chart refers to trips in 2019.
![]()
IMPACTS AND MOTIVATIONS
Finally, we have included two charts that show the motivations that most drive volunteers and gardeners to dedicate their time to grow food as well as the related impact on their wellbeing. This chart refers to impacts and motivations recorded in 2019.
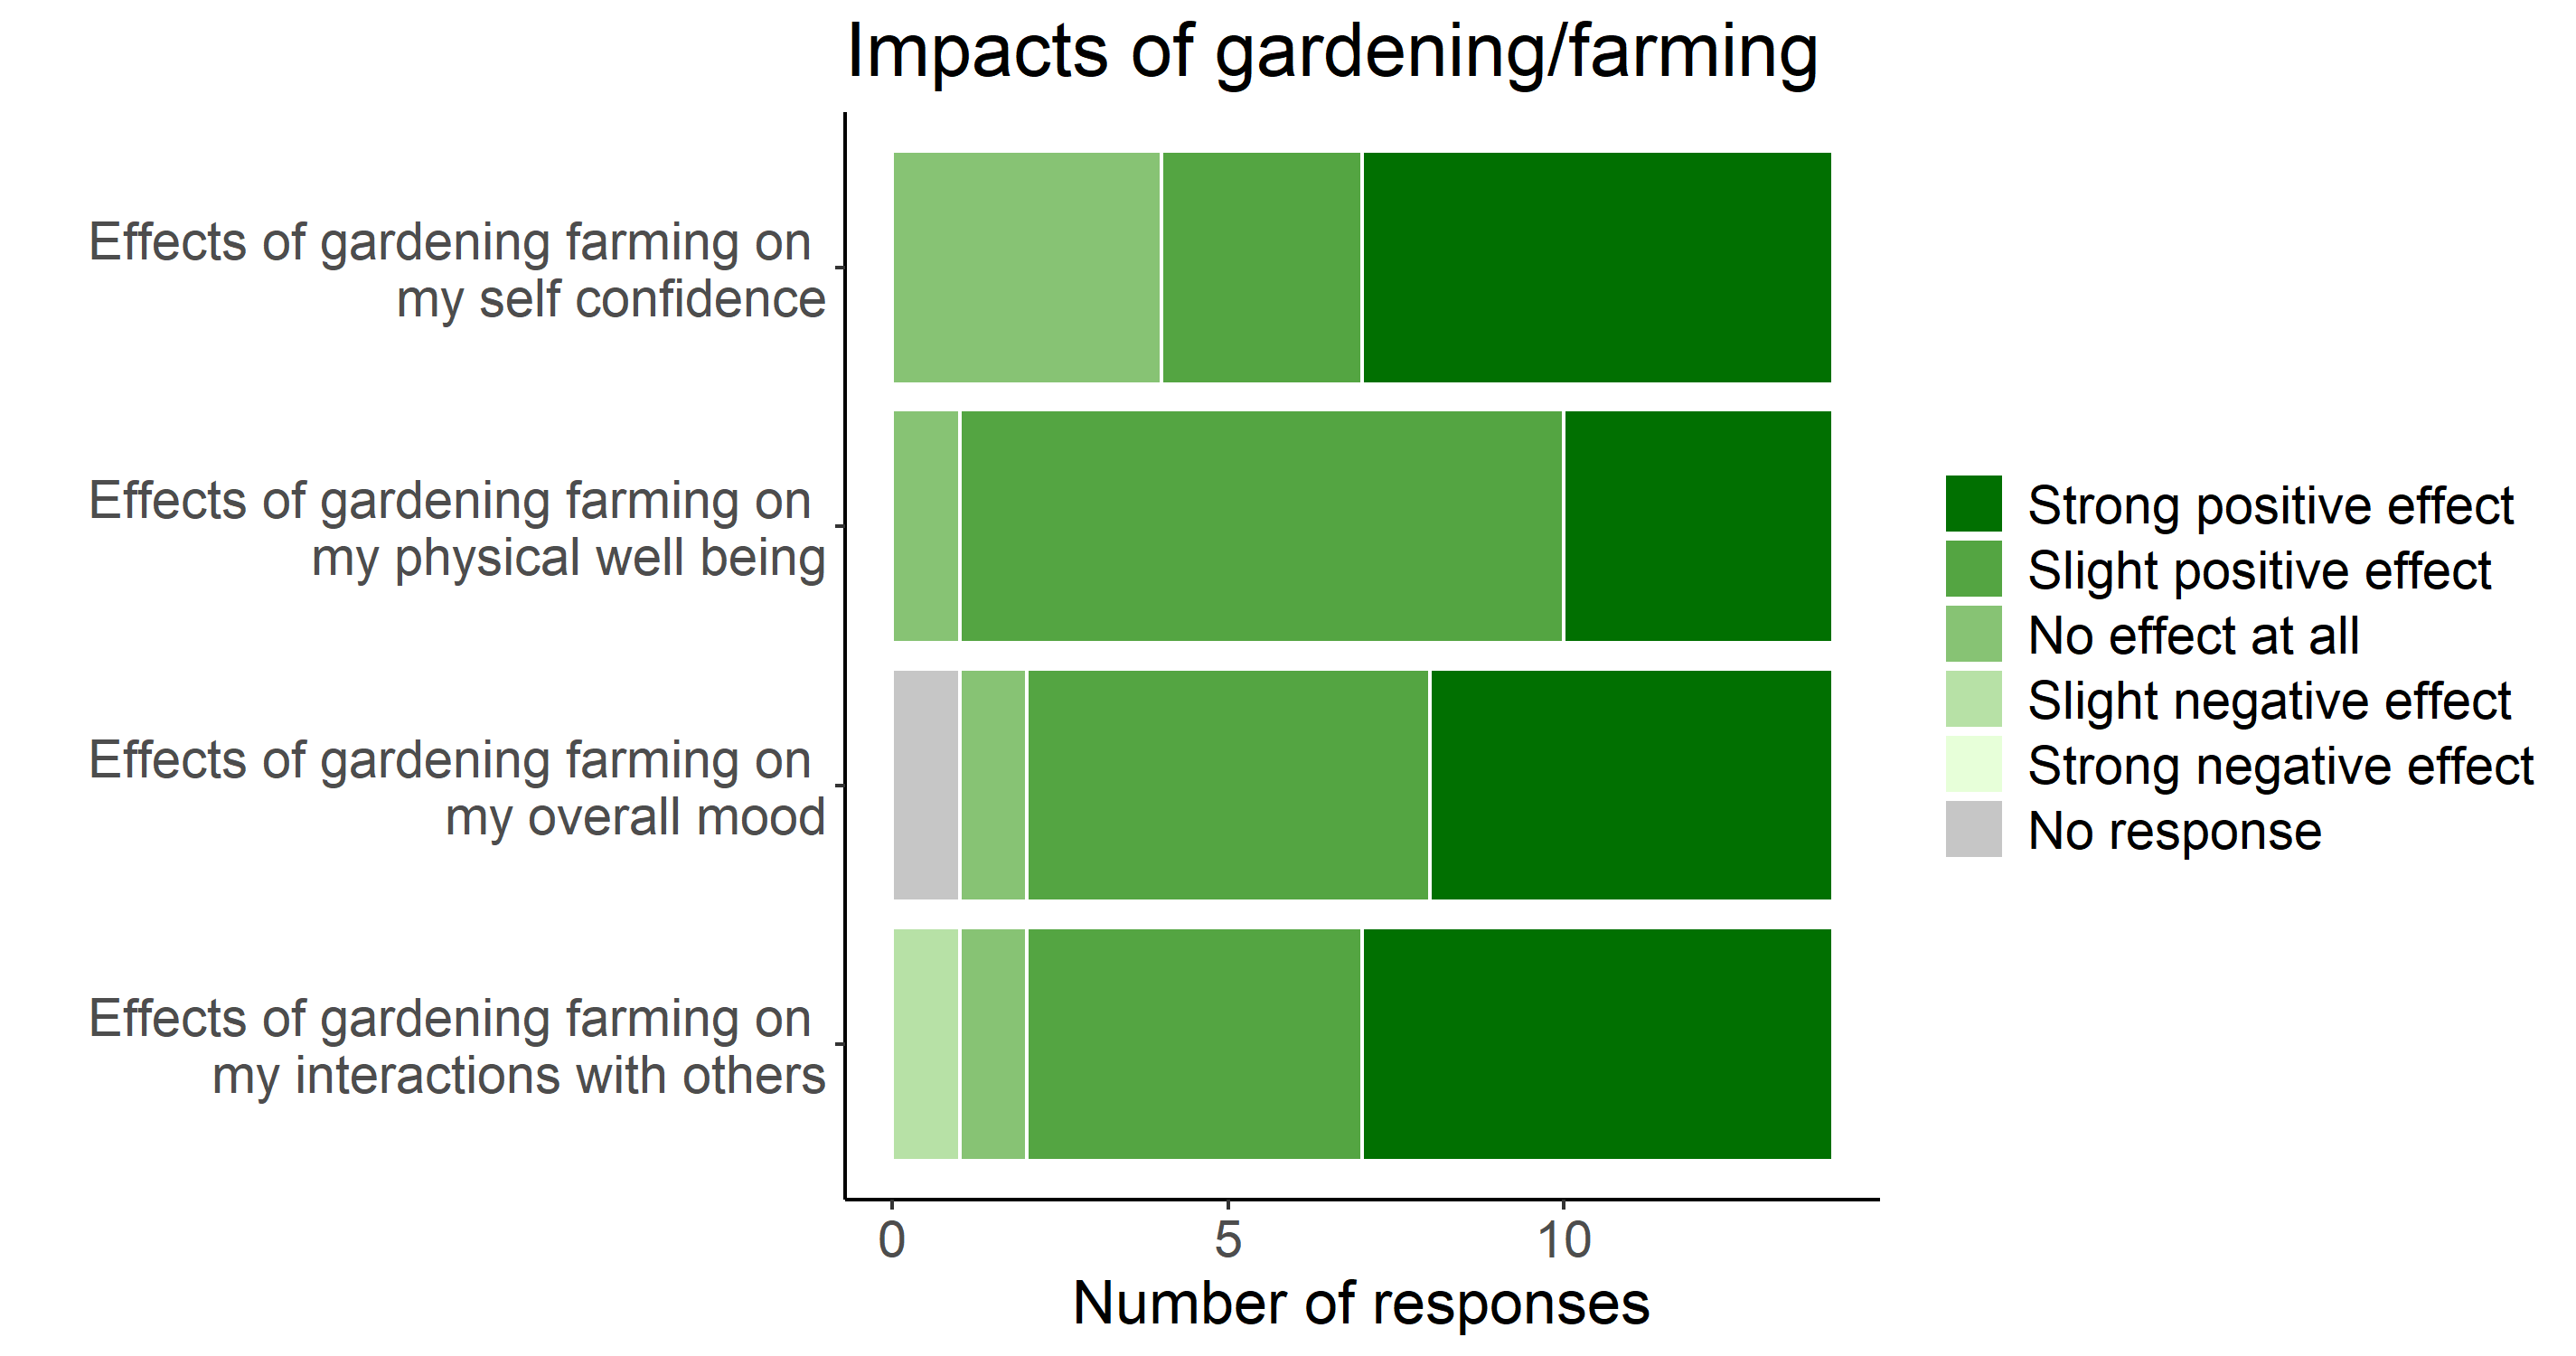
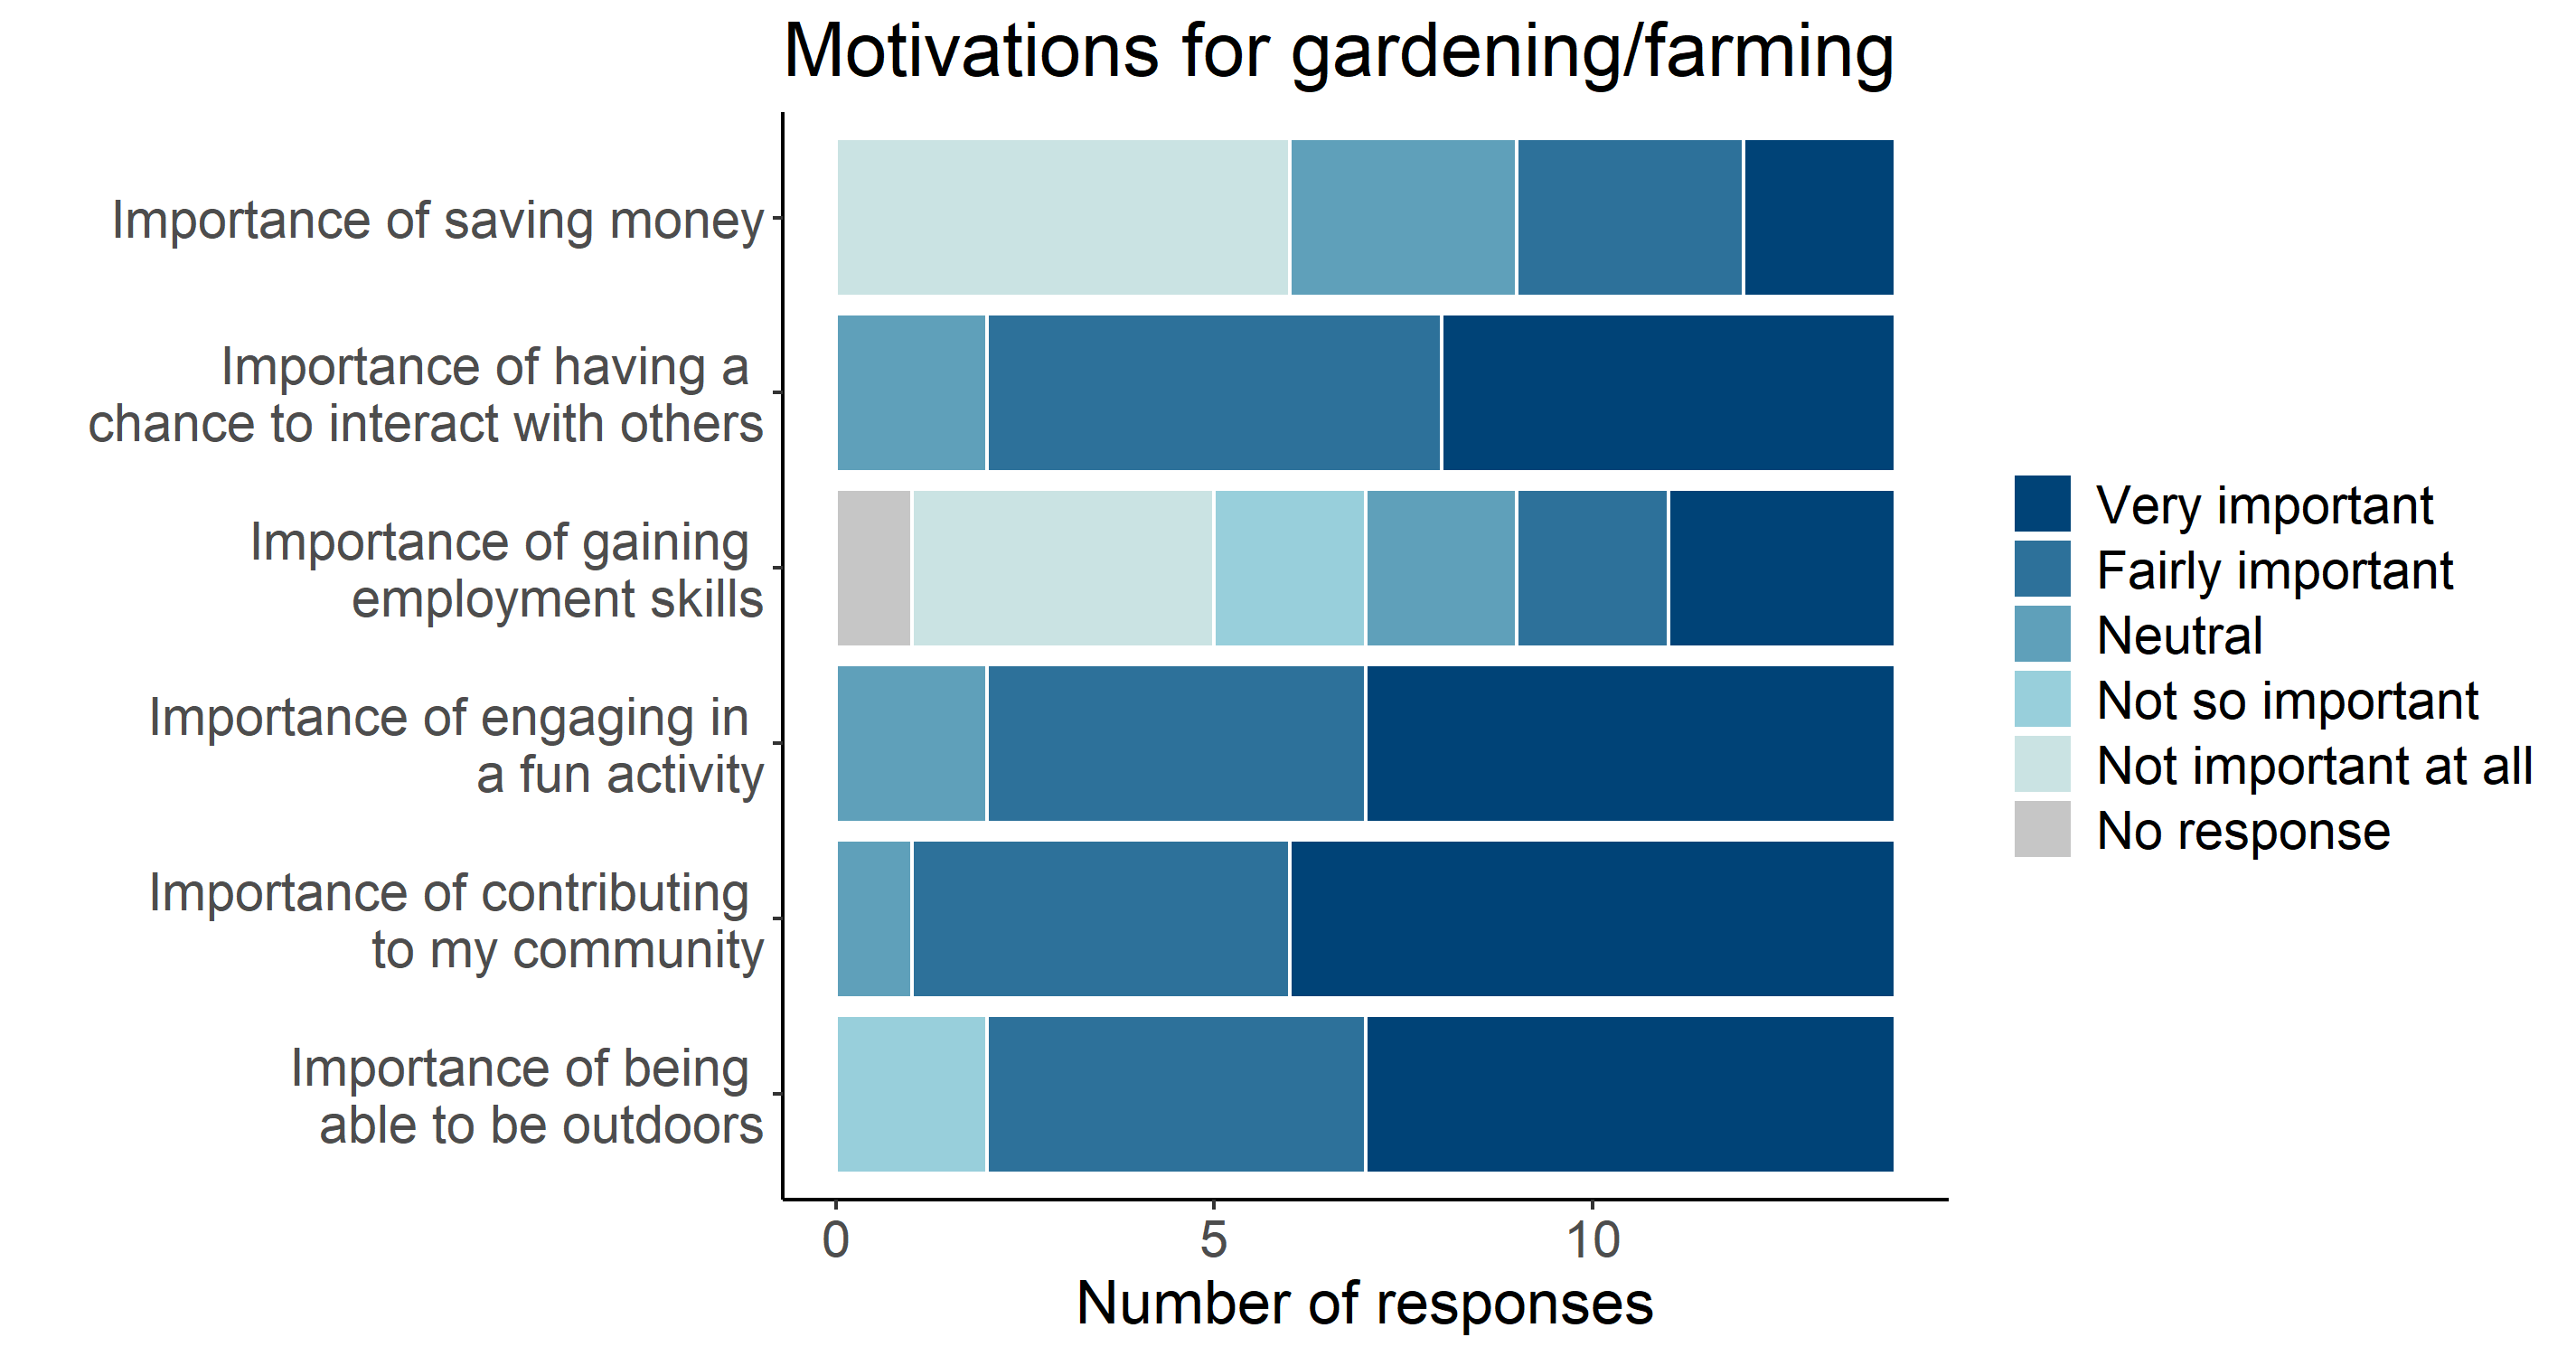
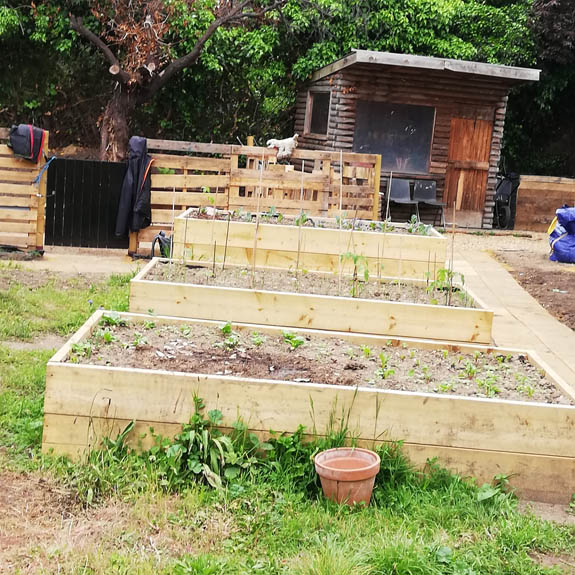
DASHBOARD
The charts included in this ‘dashboard’ show resources that have been used to grow food on the area cultivated with edible crops and the quantity of food that has been grown over two years, between March and October 2019, and March and October 2020. The last two sections of this page are dedicated to transport and the perceived immaterial benefits accrued through gardening. We decided to include transport in these charts because the fuel that is sometimes used for transport adds to the resources used to grow food.
In the last section of the page, two charts show immaterial benefits in terms of motivations for our gardeners to work in this community garden and the impact that this work generates on their health, socialisation and more. Transport, motivations and impacts were identified on the basis of a survey amongst gardeners and volunteers conducted in 2019.
All charts are based on the data that gardeners have collected with much dedication.
WATER
The water chart visualises in two bars the progressive consumption of water and electricity from March to October 2019 and 2020, together with the consumption per meter squared of food production area and kilogram of food harvested. The scale on the vertical axis of each chart shows the overall consumption. The garden is located next to offices and the electricity meter shows the overall consumption of the garden and offices. Electricity consumption of the garden is therefore based on an estimate and includes the energy consumed by the gardeners using facilities of the offices.
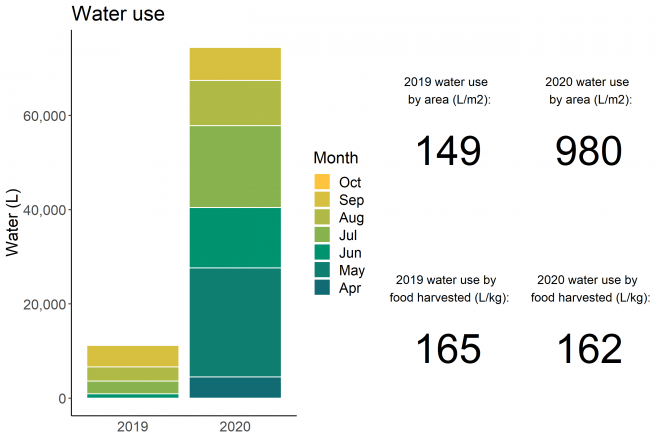
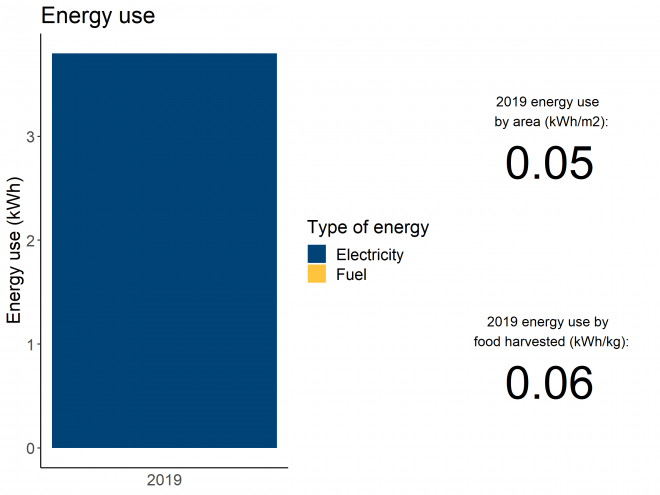
FOOD
The harvest charts, rather than showing harvest per month, show the weight of the crops harvested together with the quantity of kilograms per m2 of food production area, which gives an indication of the intensity of production.
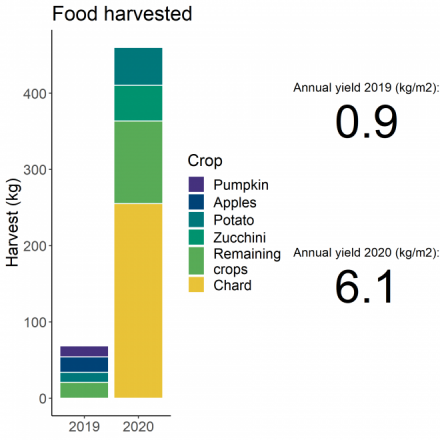
TRANSPORT
We have added a chart for trips to the garden, which is some cases generate a considerable consumption of fuel. This chart, however, needs to be interpreted. For example, in big cities such as New York or London, public transport is sometimes unavoidable and the number of kilometres may be also a consequence of the willingness of volunteers who do not live next to the garden to travel long distances. It may also indicate that a particular garden attracts many volunteers. This chart refers to trips in 2019.
![]()
IMPACTS AND MOTIVATIONS
Finally, we have included two charts that show the motivations that most drive volunteers and gardeners to dedicate their time to grow food as well as the related impact on their wellbeing. This chart refers to impacts and motivations recorded in 2019.
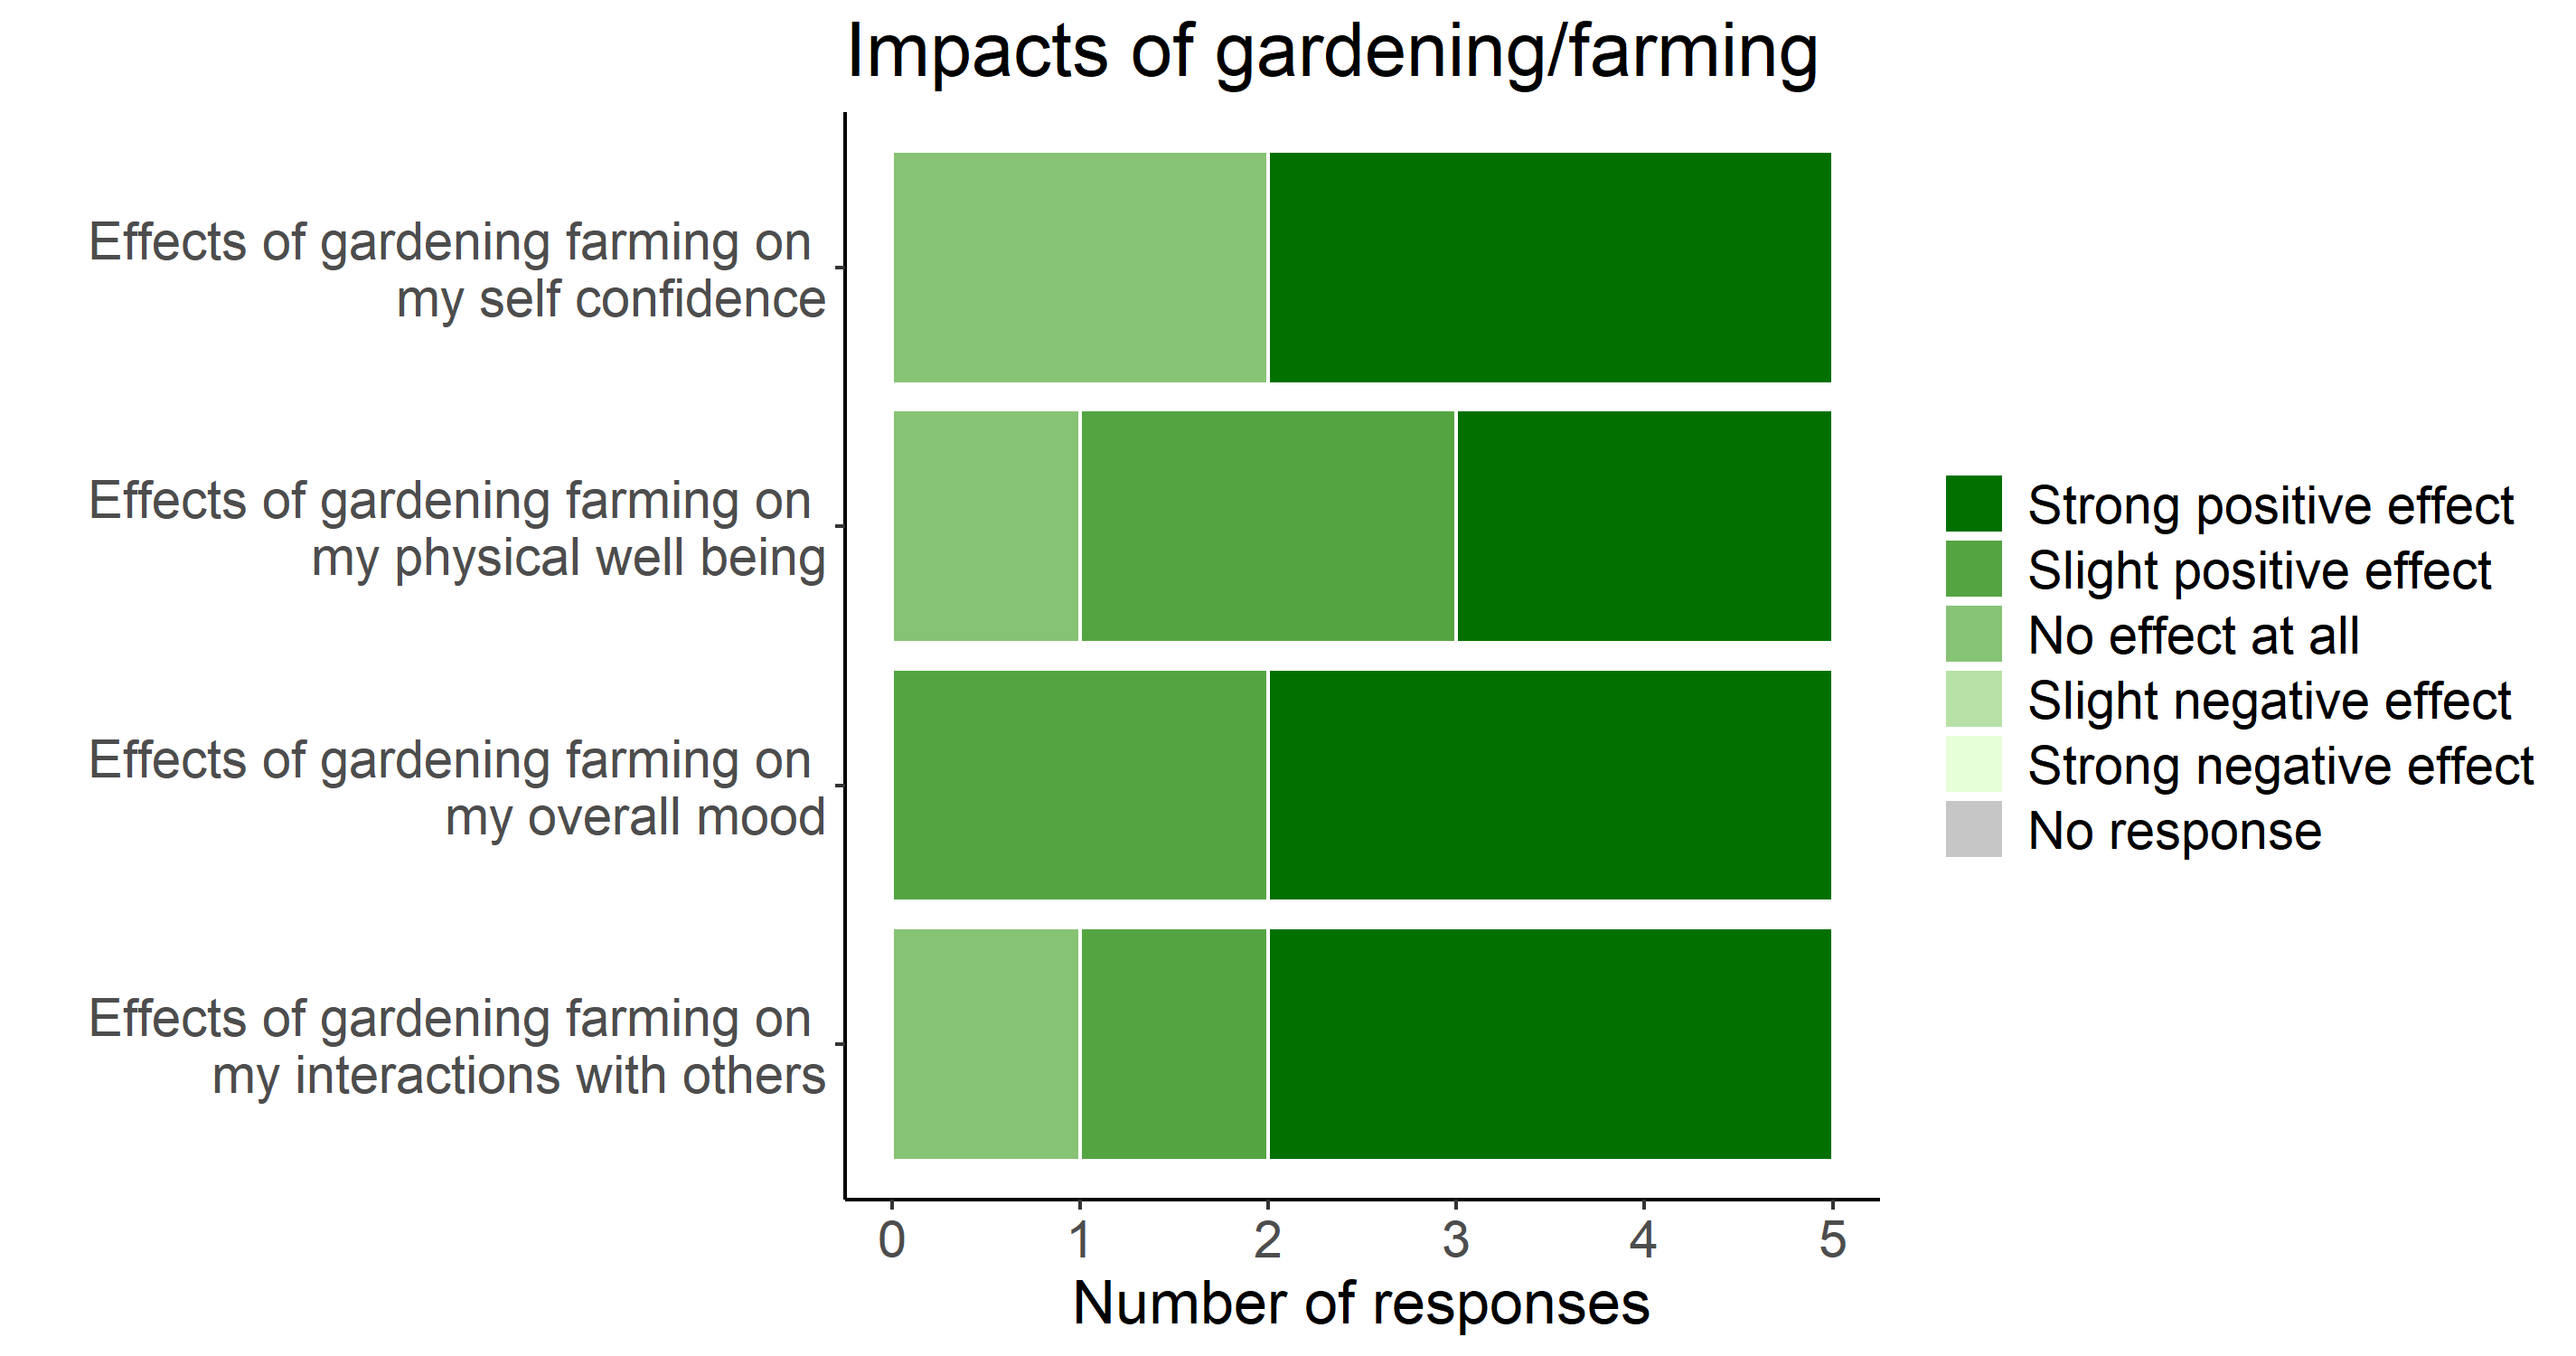
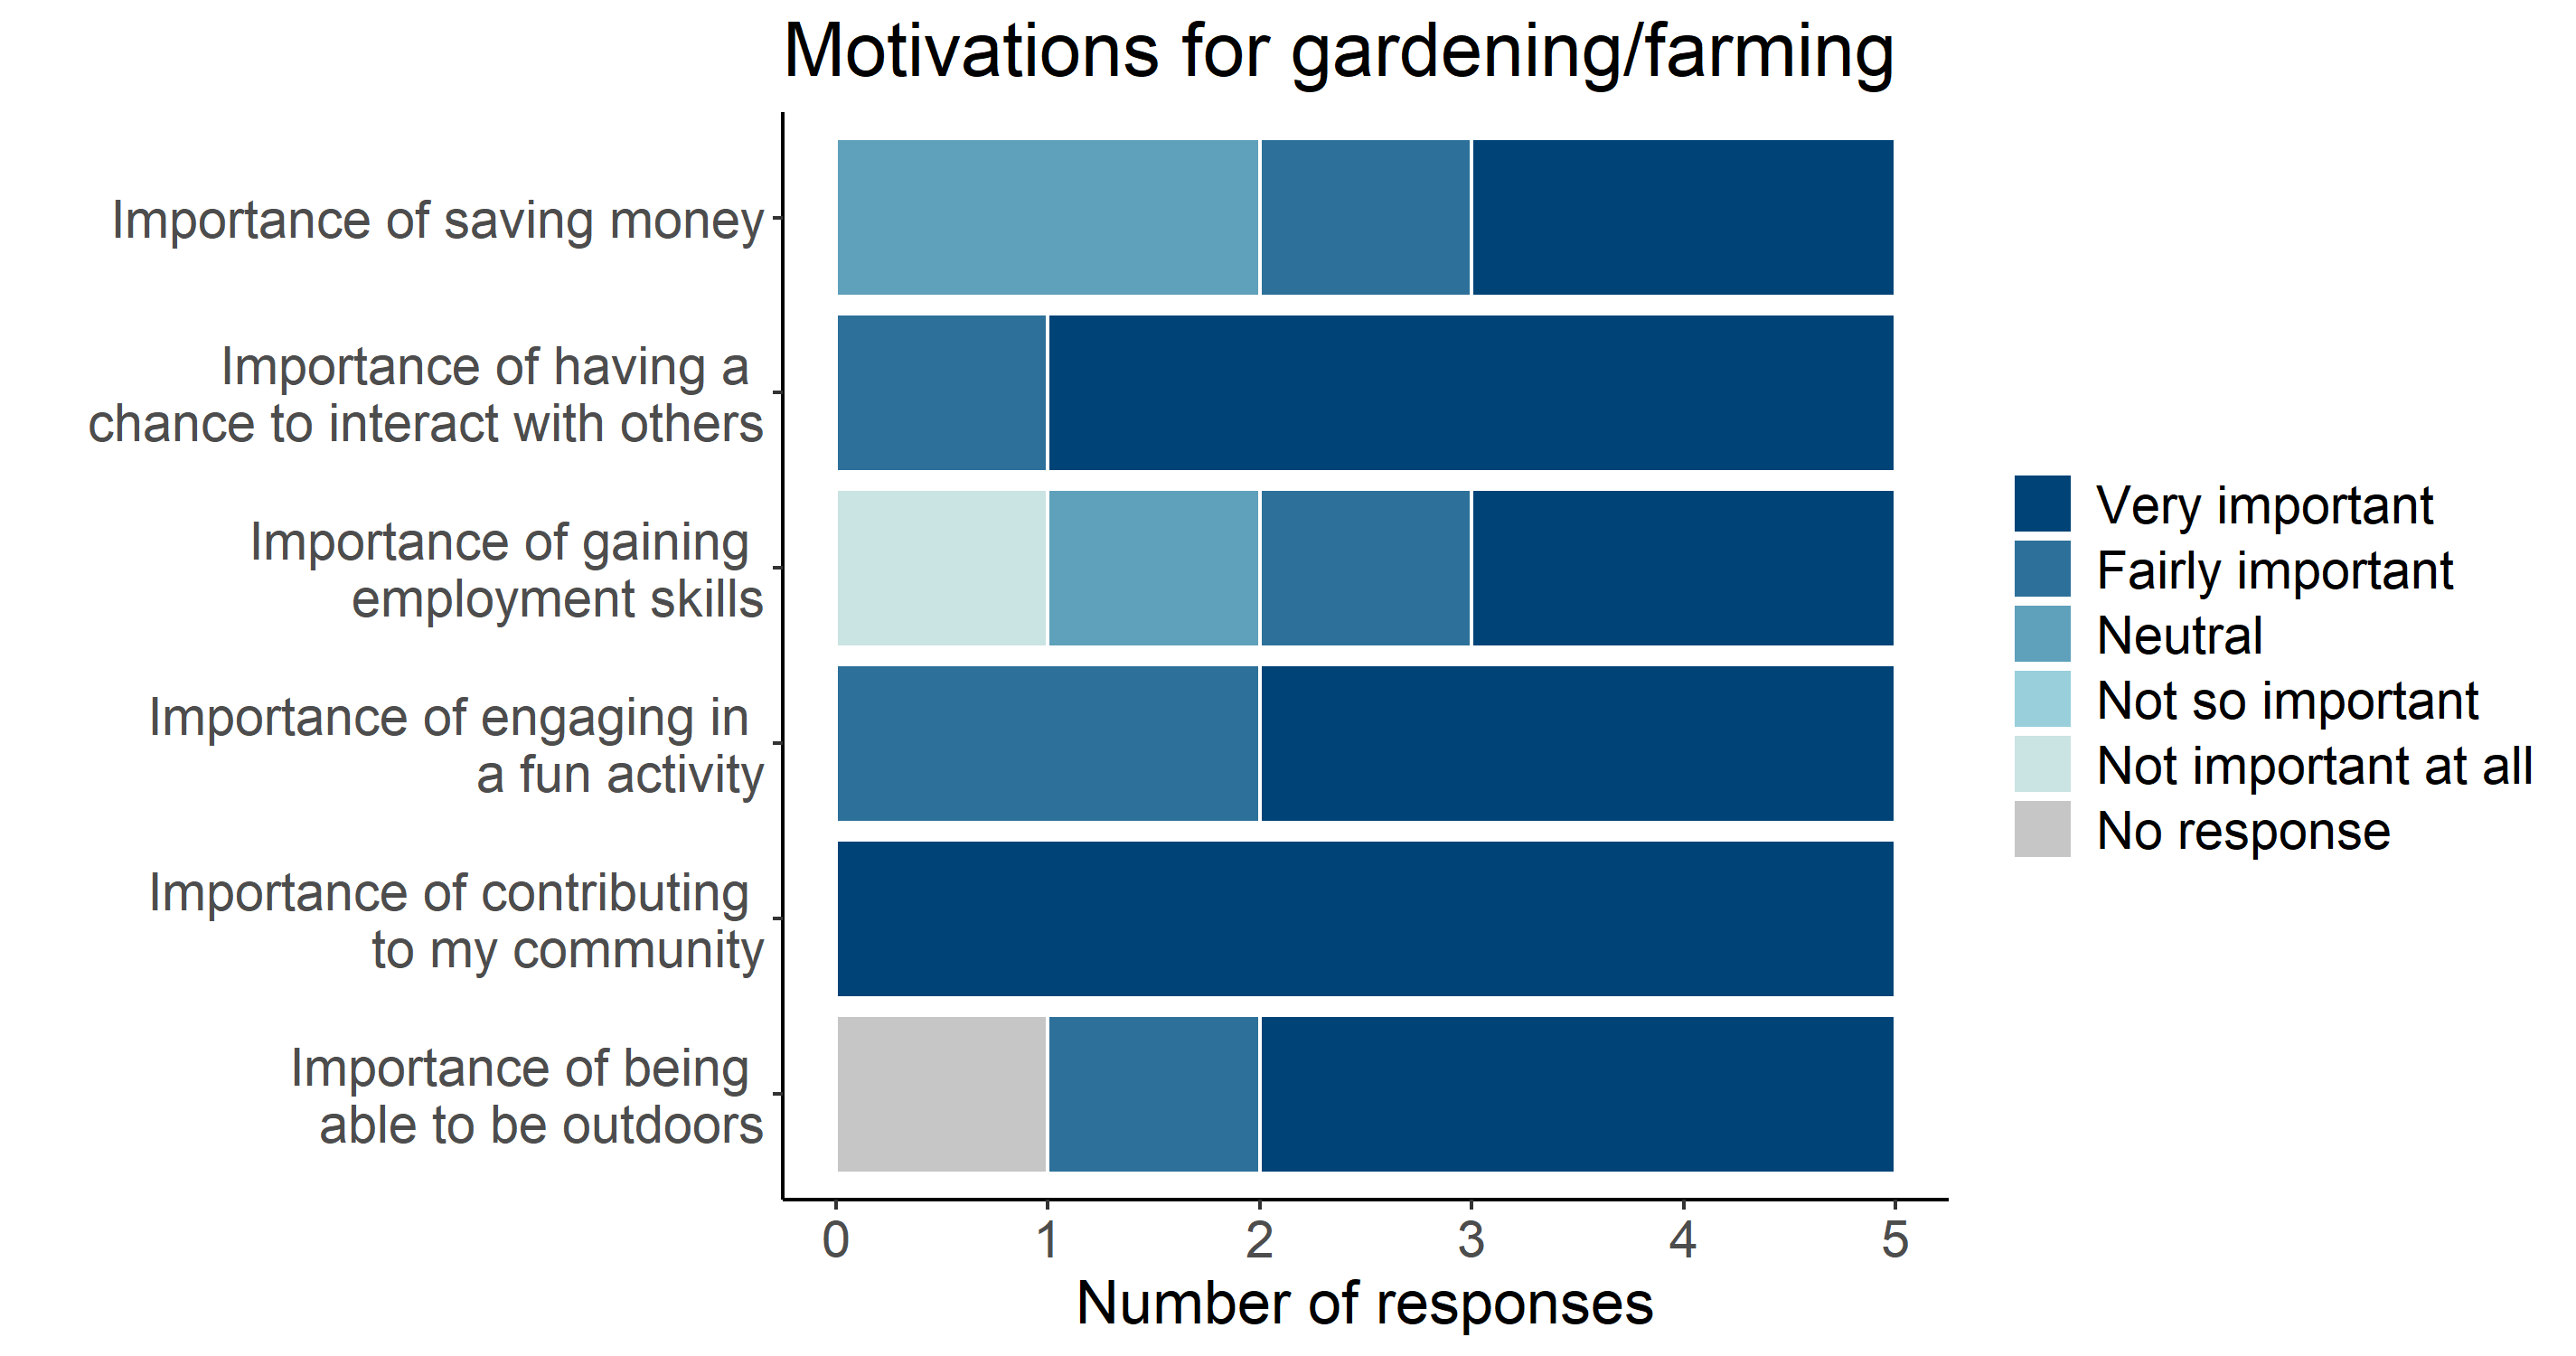
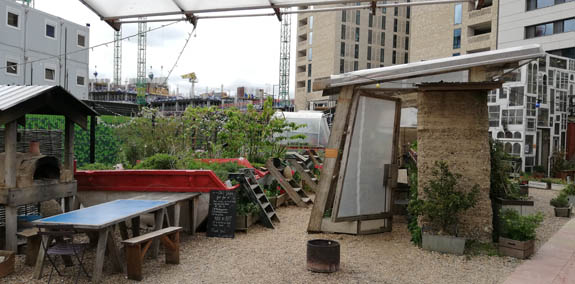
The Skip Garden is managed by Global Generation, a charity supporting the London boroughs of Camden, Islington and Southwark in creating healthy, integrated and environmentally responsible communities.
DASHBOARD
The charts included in this ‘dashboard’ show resources that have been used to grow food on the area cultivated with edible crops, the quantity of food that has been grown and the perceived immaterial benefits accrued through gardening, between March and October 2019. Charts are based on the data that gardeners have collected with much dedication.
WATER
The water chart visualises in a bar the progressive consumption of water across some months of the year, together with the consumption per meter squared of food production area and kilogram of food harvested. The scale on the vertical axis of each chart shows the overall consumption. In this case study, the food garden is part of a bigger project which includes a café and laboratories. However, the electricity chart is not included because the food garden does not use electricity.
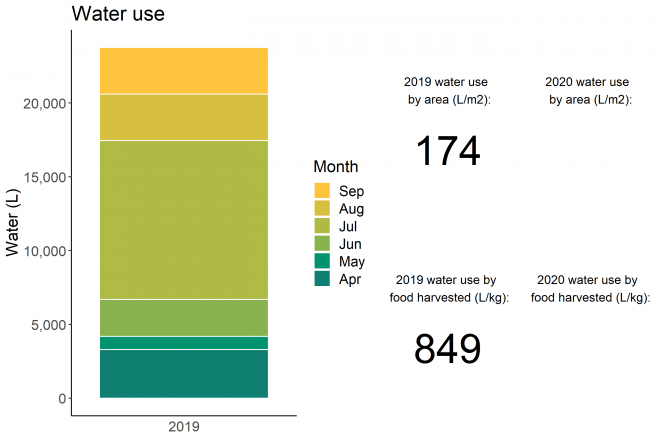
FOOD
The harvest chart, rather than showing harvest per month, shows the weight of the crops that were picked together with the quantity of kilograms per meter squared of food production area, which gives an indication of the intensity of production.
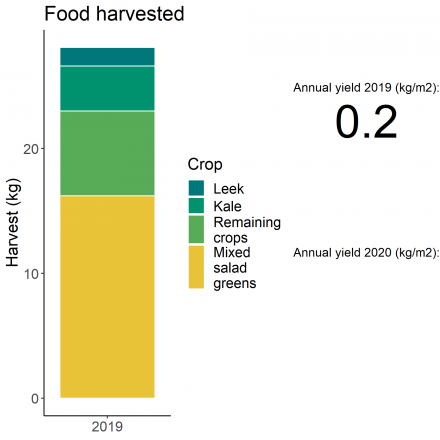
TRANSPORT
We have added a chart for trips to the garden, which is some cases generate a considerable consumption of fuel. This chart, however, needs to be interpreted. For example, in big cities such as New York or London, public transport is sometimes unavoidable and the quantity of kilometres may be also a consequence of the willingness of volunteers who do not live next to the garden to travel long distances. It may also indicate that a particular garden attracts many volunteers. In this case study, all gardeners live in the area and walk to the site.
![]()
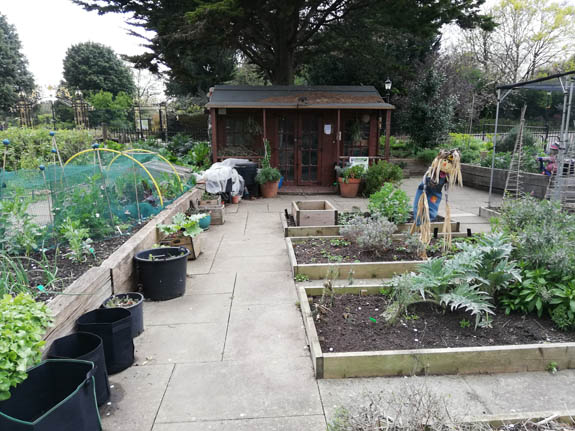
DASHBOARD
The charts included in this ‘dashboard’ show resources that have been used to grow food on the area cultivated with edible crops, the quantity of food that has been grown and the perceived immaterial benefits accrued through gardening, between March and October 2019. Charts are based on the data that gardeners have collected with much dedication.
WATER
The water chart visualises in a bar the progressive consumption of water and electricity across some months of the year, together with the consumption per meter squared of food production area and kilogram of food harvested. The scale on the vertical axis of each chart shows the overall consumption. The garden is located next to offices and the electricity meter shows the overall consumption of the garden and offices. Electricity consumption of the garden is therefore based on an estimate and includes the energy consumed by the gardeners using facilities of the offices.
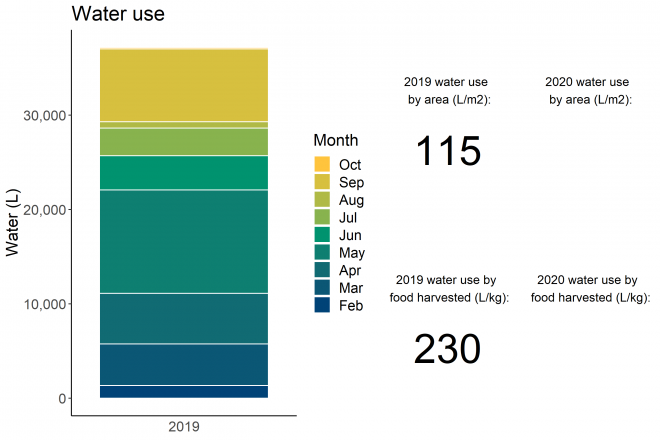
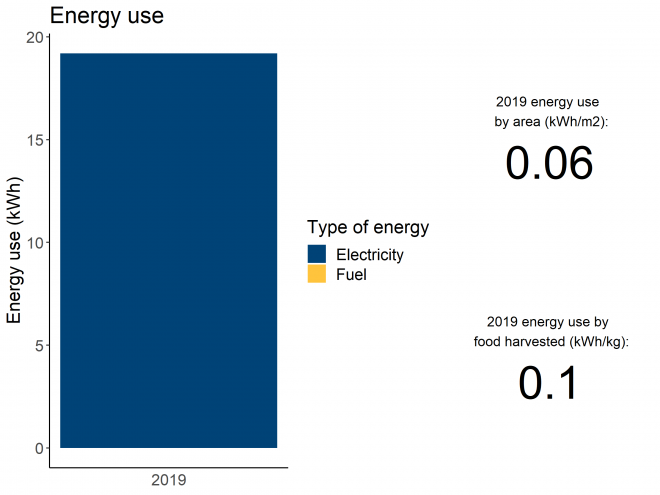
FOOD
The harvest chart, rather than showing harvest per month, shows the weight of the crops that were picked together with the quantity of kilograms per meter squared of food production area, which gives an indication of the intensity of production.
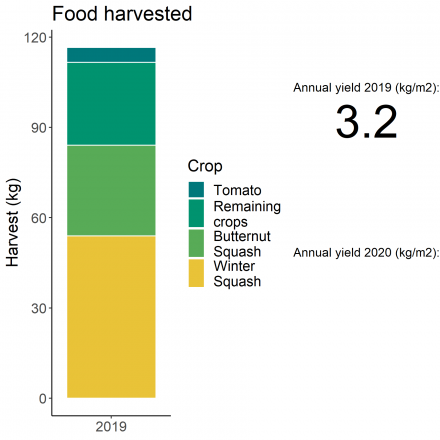
TRANSPORT
We have added a chart for trips to the garden, which is some cases generate a considerable consumption of fuel. This chart, however, needs to be interpreted. For example, in big cities such as New York or London, public transport is sometimes unavoidable and the quantity of kilometres may be also a consequence of the willingness of volunteers who do not live next to the garden to travel long distances. It may also indicate that a particular garden attracts many volunteers.
![]()
IMPACTS AND MOTIVATIONS
Finally, we have included two charts that show the motivations that most drive volunteers and gardeners to dedicate their time to grow food as well as the related impact on their wellbeing.
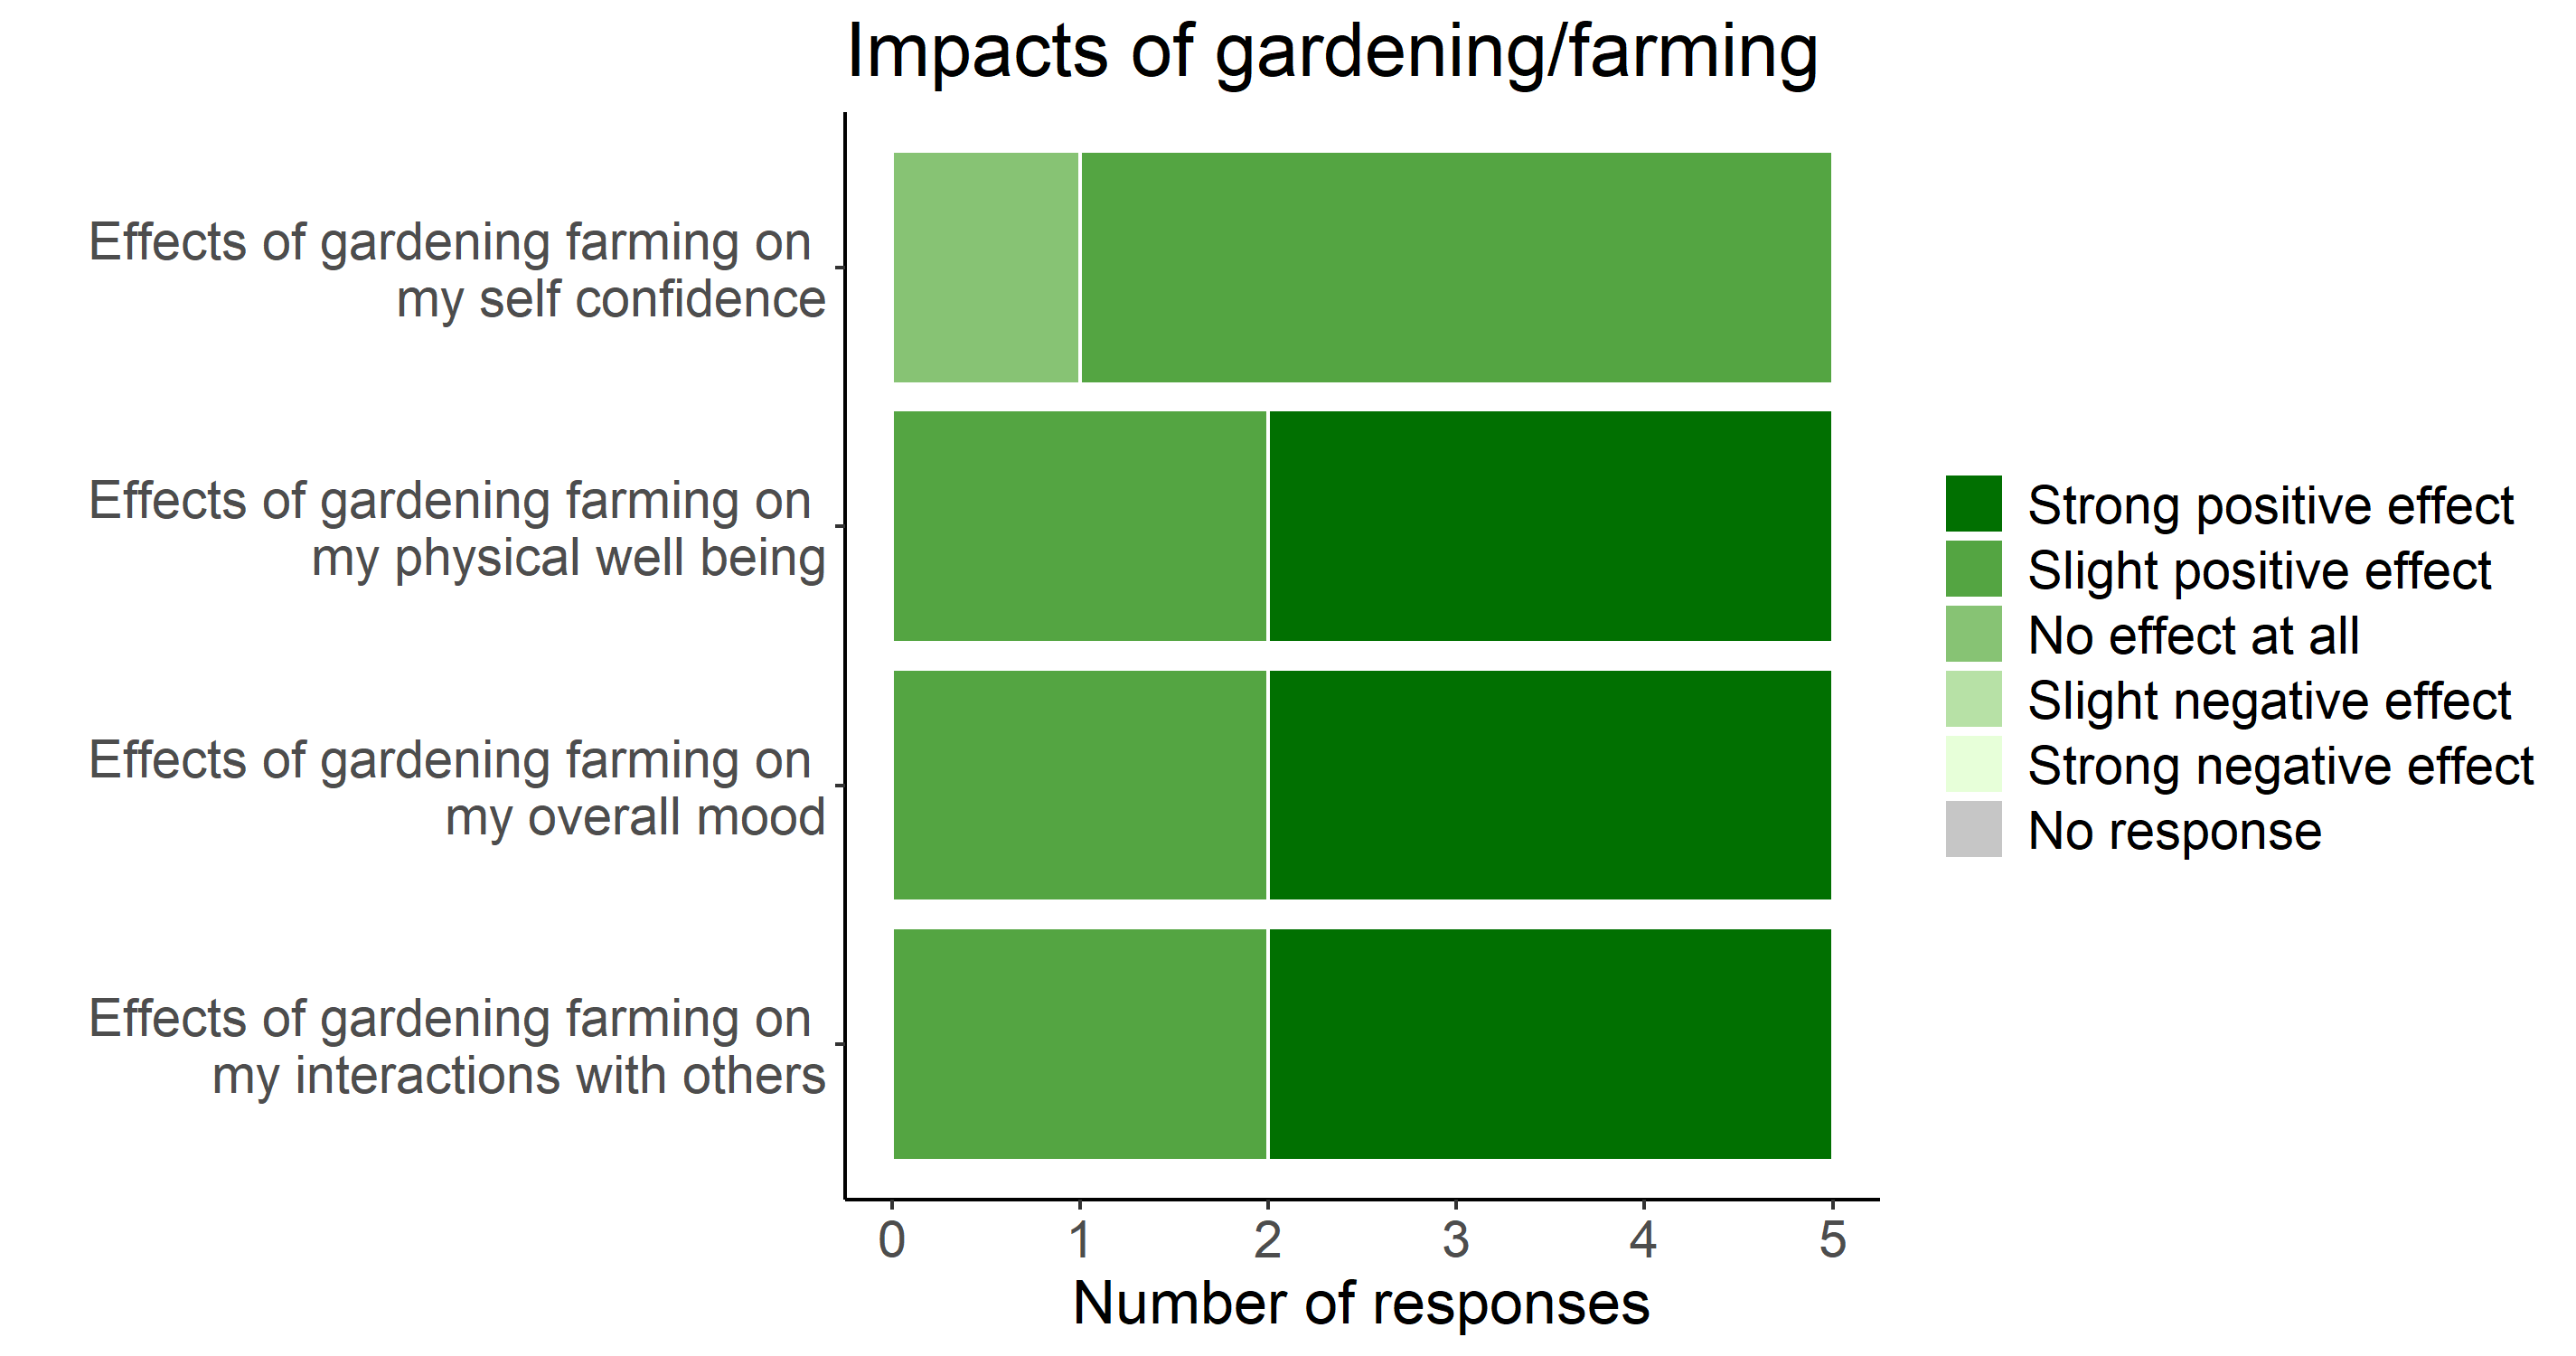
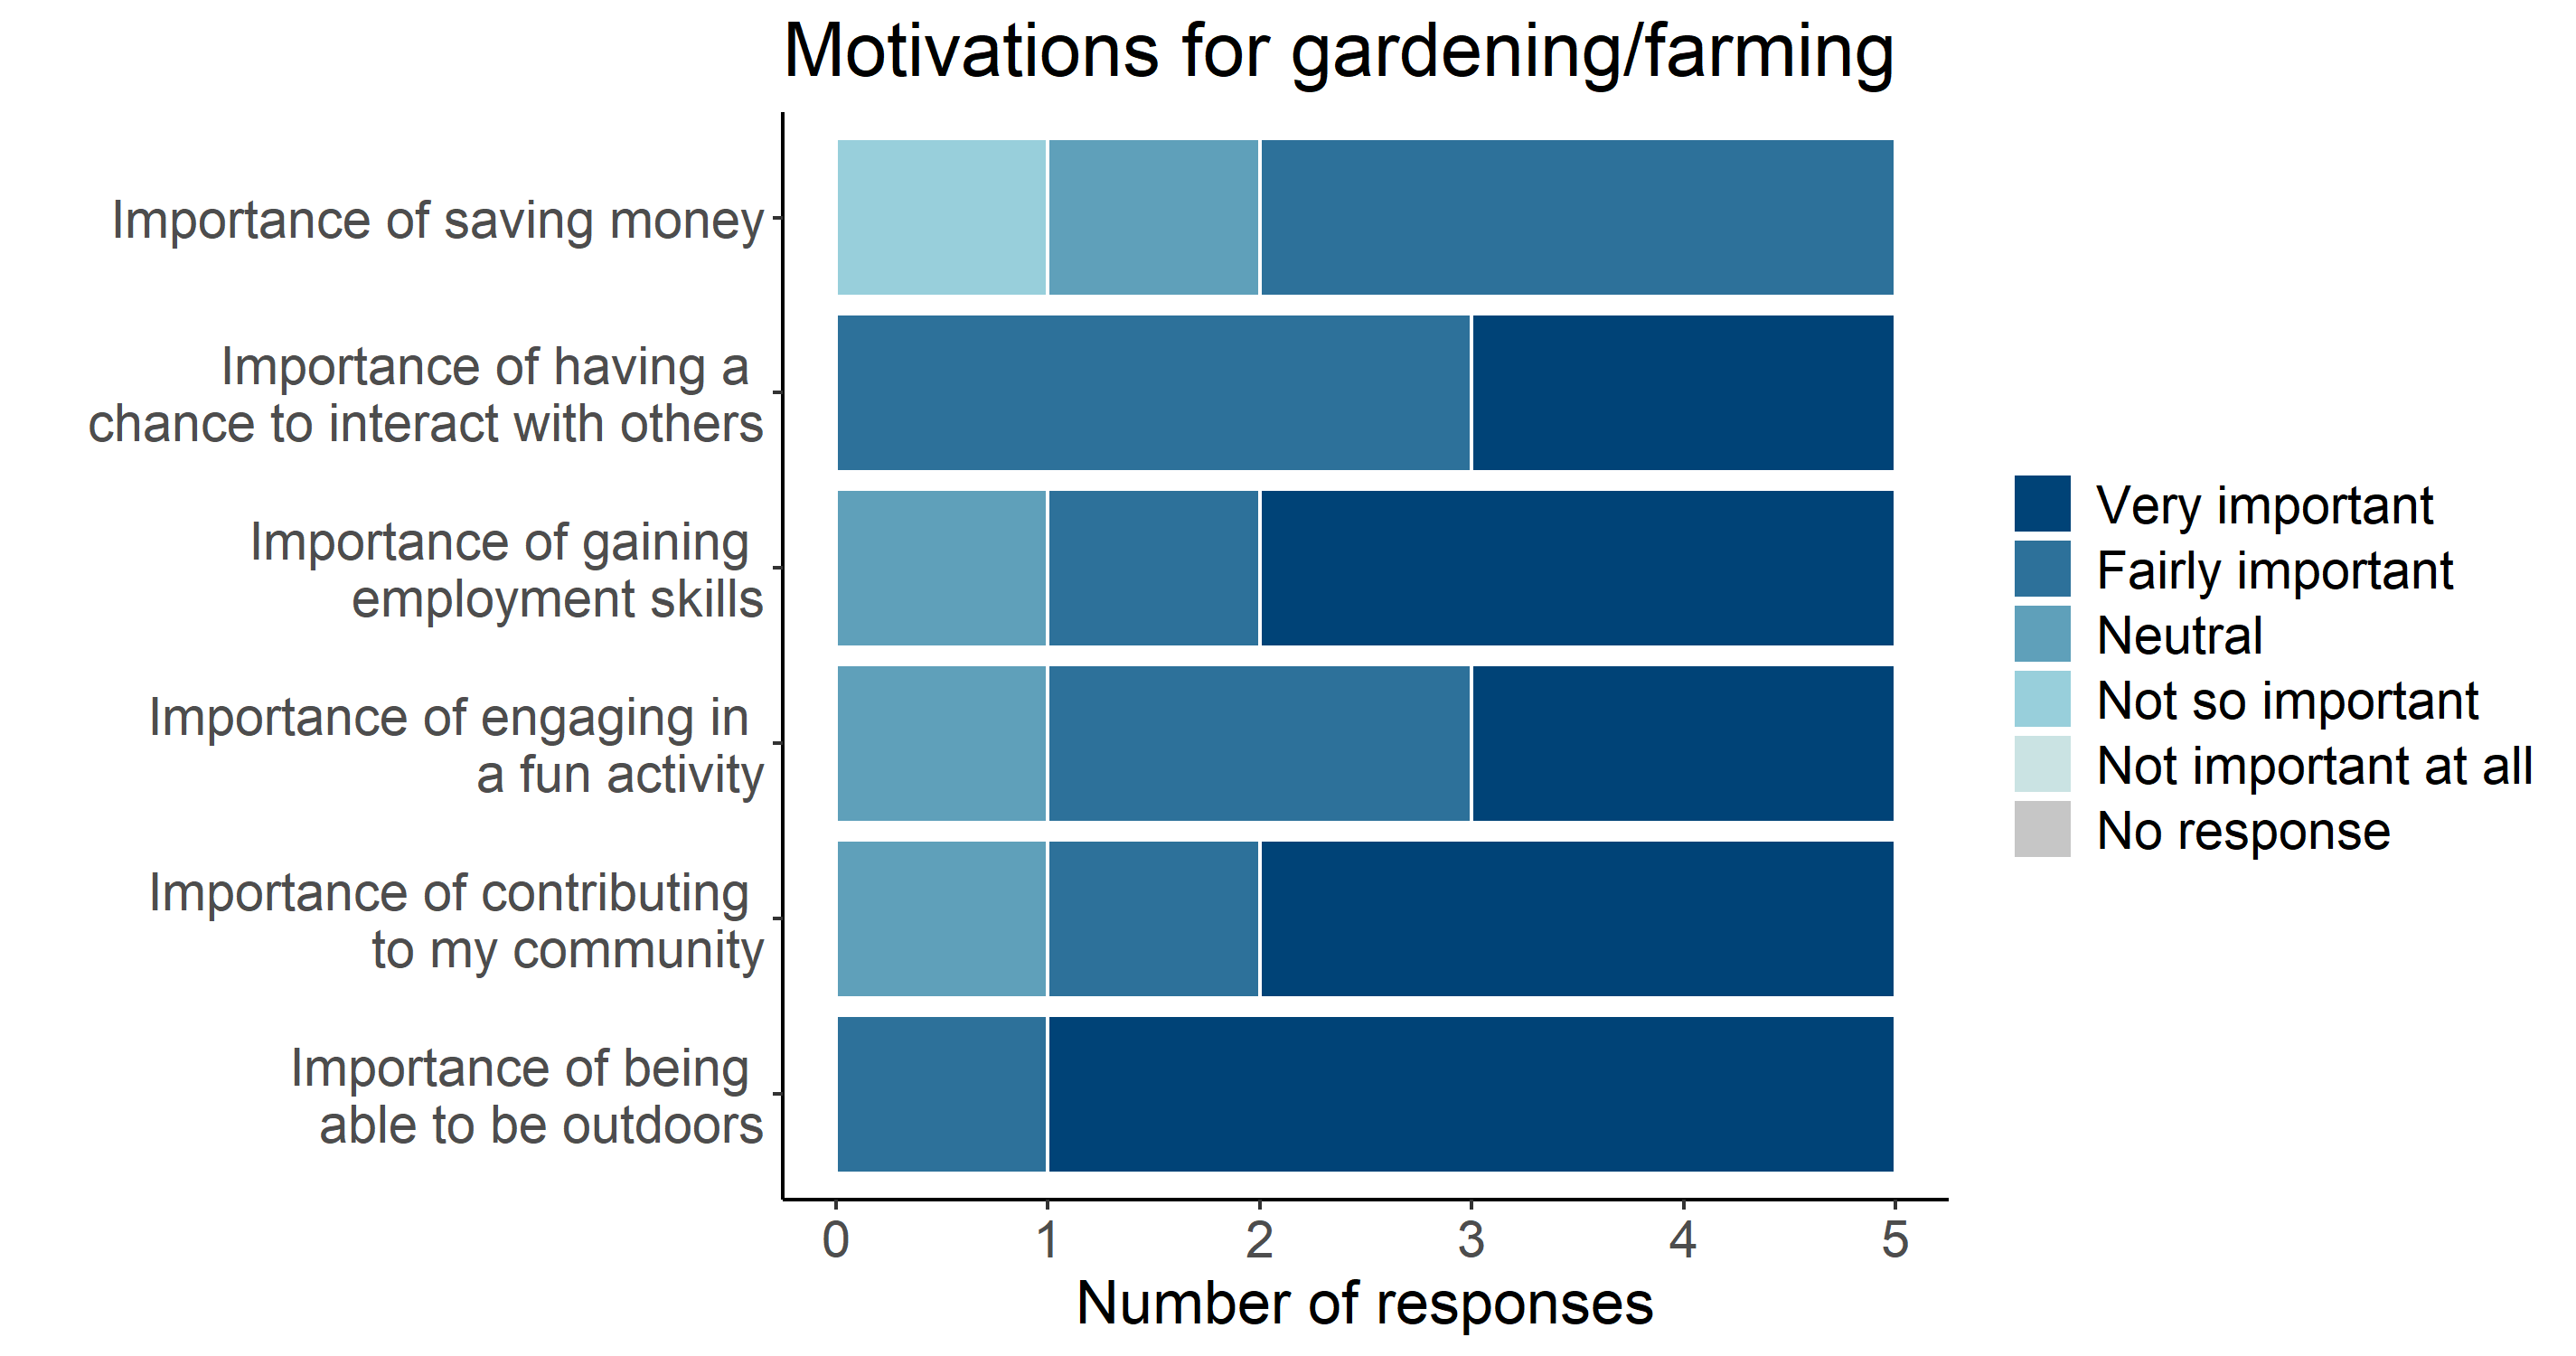
DASHBOARD
The charts included in this ‘dashboard’ show resources that have been used to grow food on the area cultivated with edible crops, the quantity of food that has been grown and the perceived immaterial benefits accrued through gardening, between March and October 2019. Charts are based on the data that gardeners have collected with much dedication.
WATER
The water chart visualises in a bar the progressive consumption of water and electricity across some months of the year, together with the consumption per meter squared of food production area and kilogram of food harvested. The scale on the vertical axis of each chart shows the overall consumption. The electricity chart shows only the fuel for gardening tools. The site is not connected to the electrical grid.
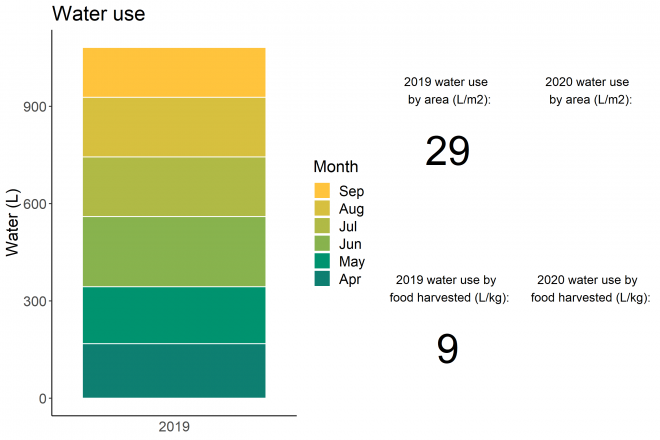
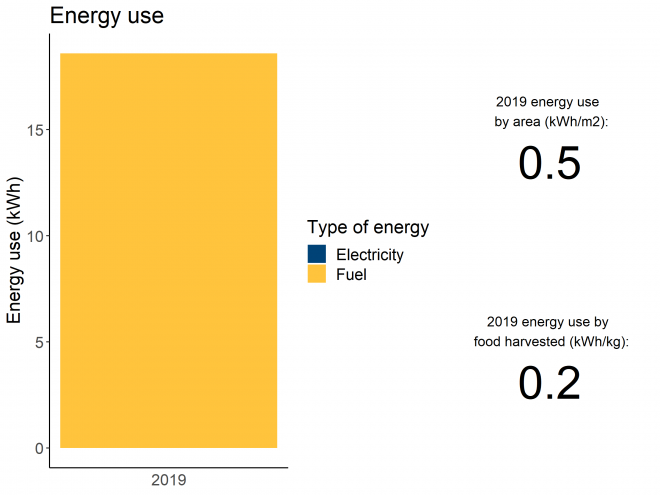
FOOD
The harvest chart, rather than showing harvest per month, shows the weight of the crops that were picked together with the quantity of kilograms per meter squared of food production area, which gives an indication of the intensity of production.
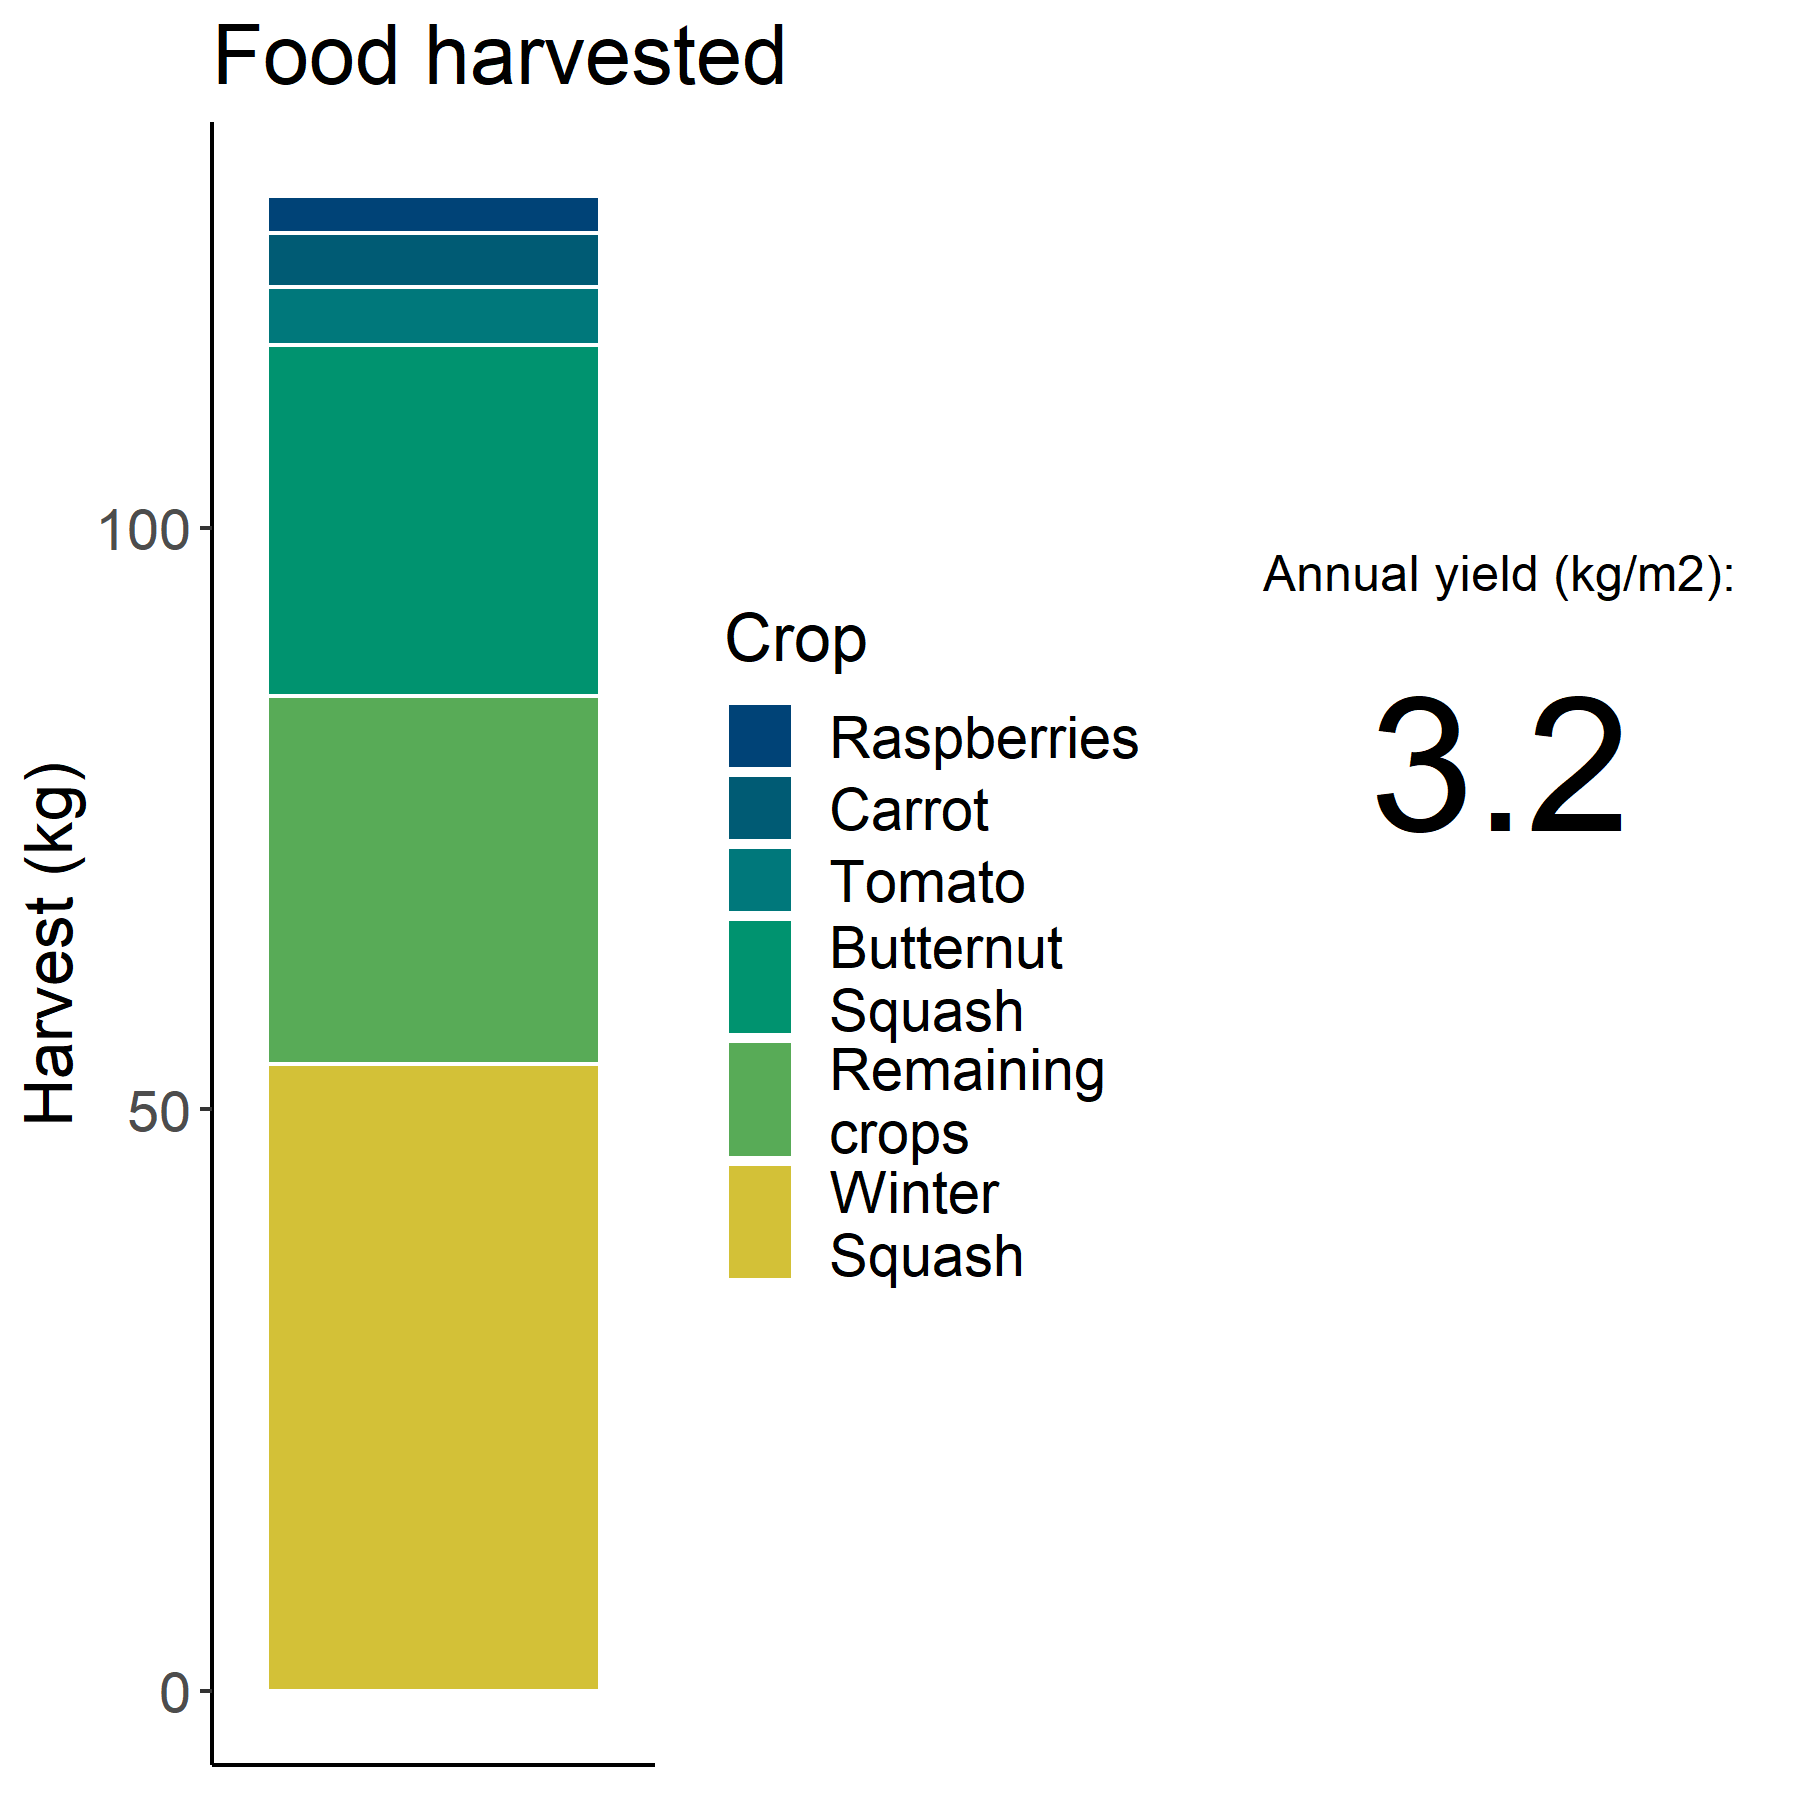
TRANSPORT
We have added a chart for trips to the garden, which is some cases generate a considerable consumption of fuel. This chart, however, needs to be interpreted. For example, in big cities such as New York or London, public transport is sometimes unavoidable and the quantity of kilometres may be also a consequence of the willingness of volunteers who do not live next to the garden to travel long distances. It may also indicate that a particular garden attracts many volunteers. In this case study, all gardeners live in the area and walk to the site.
![]()
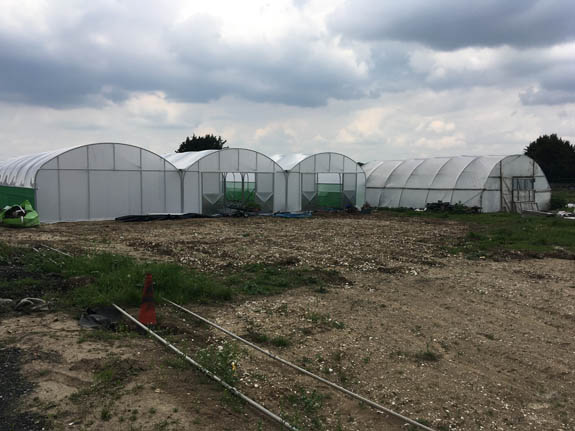
DASHBOARD
The charts included in this ‘dashboard’ show resources that have been used to grow food on the area cultivated with edible crops and the quantity of food that has been grown over two years, between March and October 2019, and March and October 2020. The last two sections of this page are dedicated to transport and the perceived immaterial benefits accrued through gardening. We decided to include transport in these charts because the fuel that is sometimes used for transport adds to the resources used to grow food.
In the last section of the page, two charts show immaterial benefits in terms of motivations for our gardeners to work in this community garden and the impact that this work generates on their health, socialisation and more. Transport, motivations and impacts were identified on the basis of a survey amongst gardeners and volunteers conducted in 2019.
All charts are based on the data that gardeners have collected with much dedication.
WATER
The water chart visualises in two bars the progressive consumption of water and electricity from March to October 2019 and 2020, together with the consumption per meter squared of food production area and kilogram of food harvested. The scale on the vertical axis of each chart shows the overall consumption. The garden is located next to offices and the electricity meter shows the overall consumption of the garden and offices. Electricity consumption of the garden is therefore based on an estimate and includes the energy consumed by the gardeners using facilities of the offices.
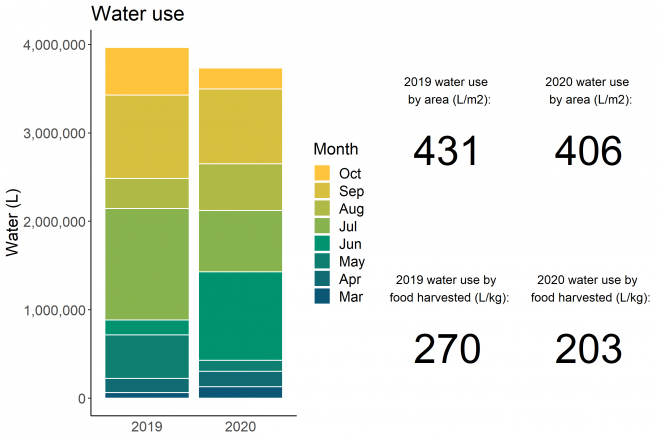
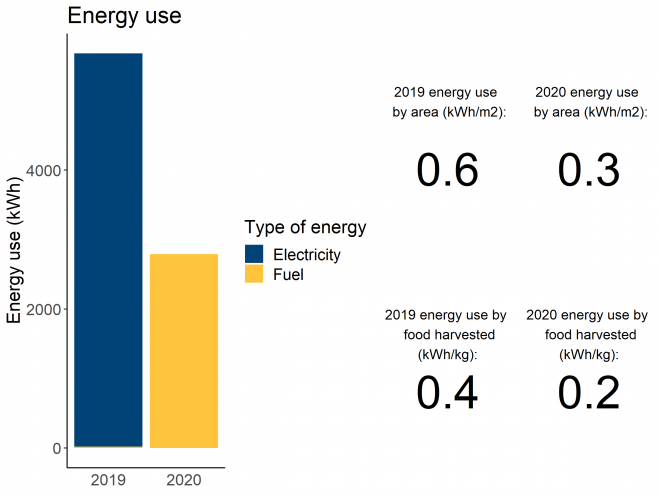
FOOD
The harvest charts, rather than showing harvest per month, show the weight of the crops harvested together with the quantity of kilograms per m2 of food production area, which gives an indication of the intensity of production.
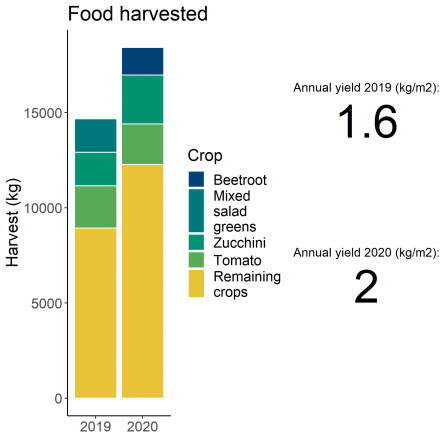
TRANSPORT
We have added a chart for trips to the garden, which is some cases generate a considerable consumption of fuel. This chart, however, needs to be interpreted. For example, in big cities such as New York or London, public transport is sometimes unavoidable and the number of kilometres may be also a consequence of the willingness of volunteers who do not live next to the garden to travel long distances. It may also indicate that a particular garden attracts many volunteers. This chart refers to trips in 2019.
![]()
IMPACTS AND MOTIVATIONS
Finally, we have included two charts that show the motivations that most drive volunteers and gardeners to dedicate their time to grow food as well as the related impact on their wellbeing. This chart refers to impacts and motivations recorded in 2019.
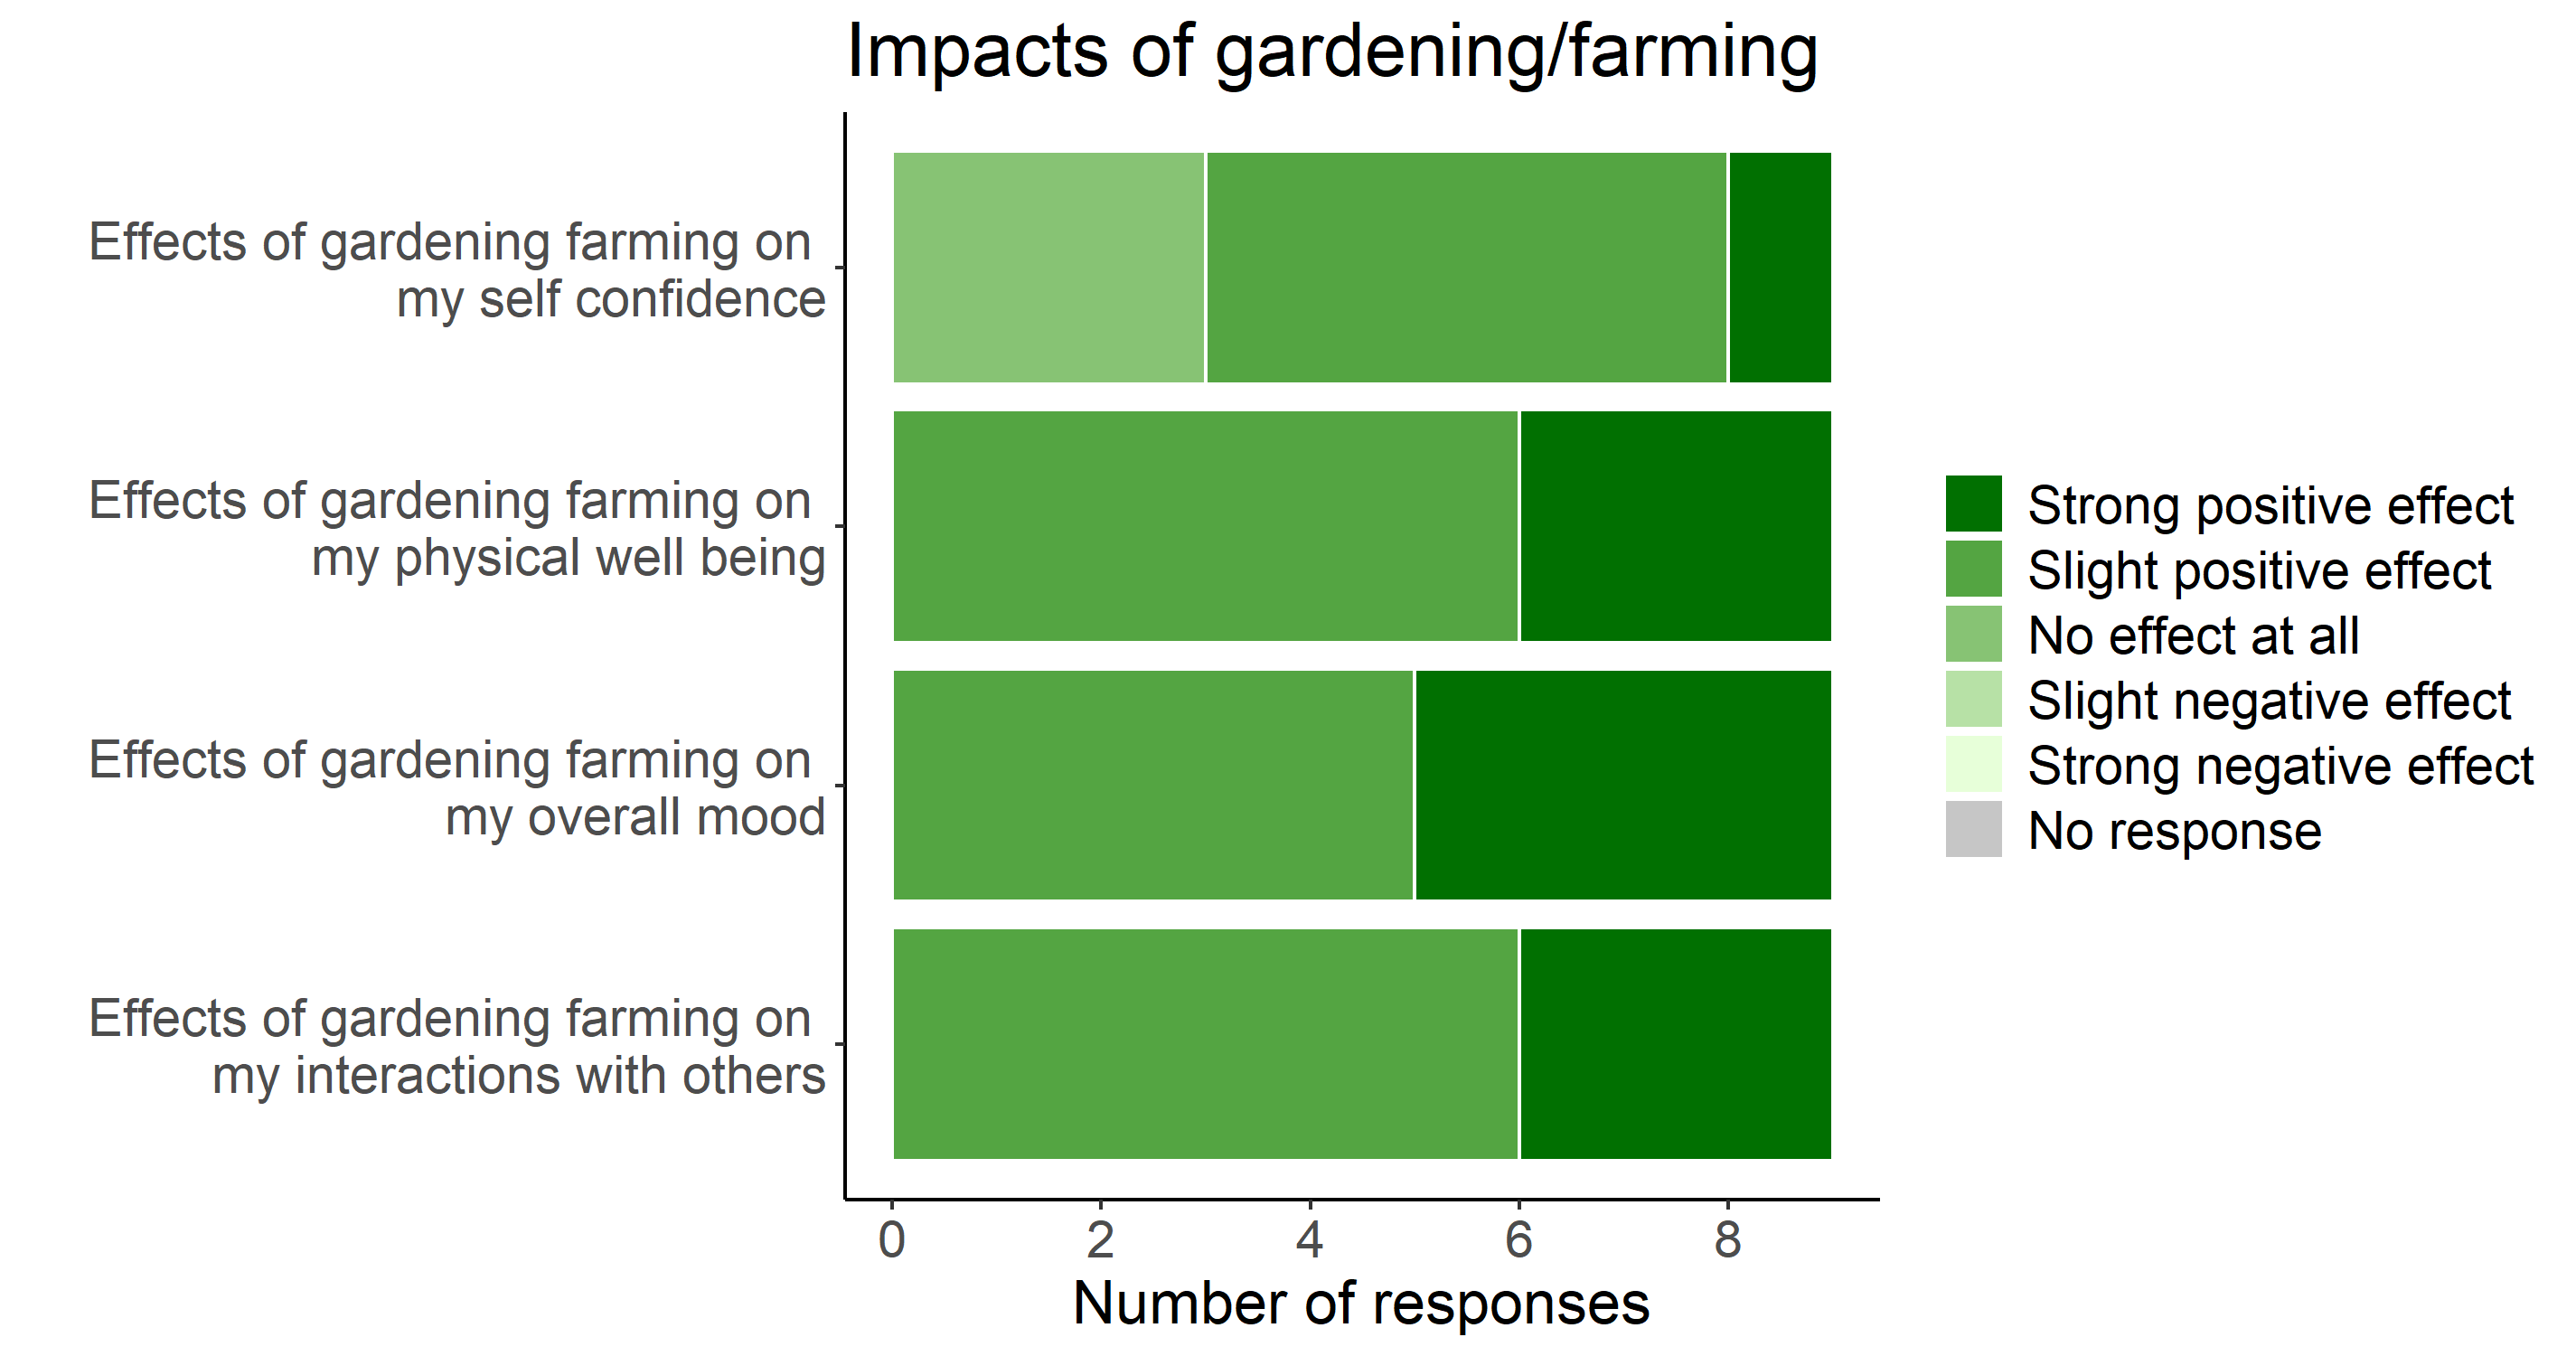
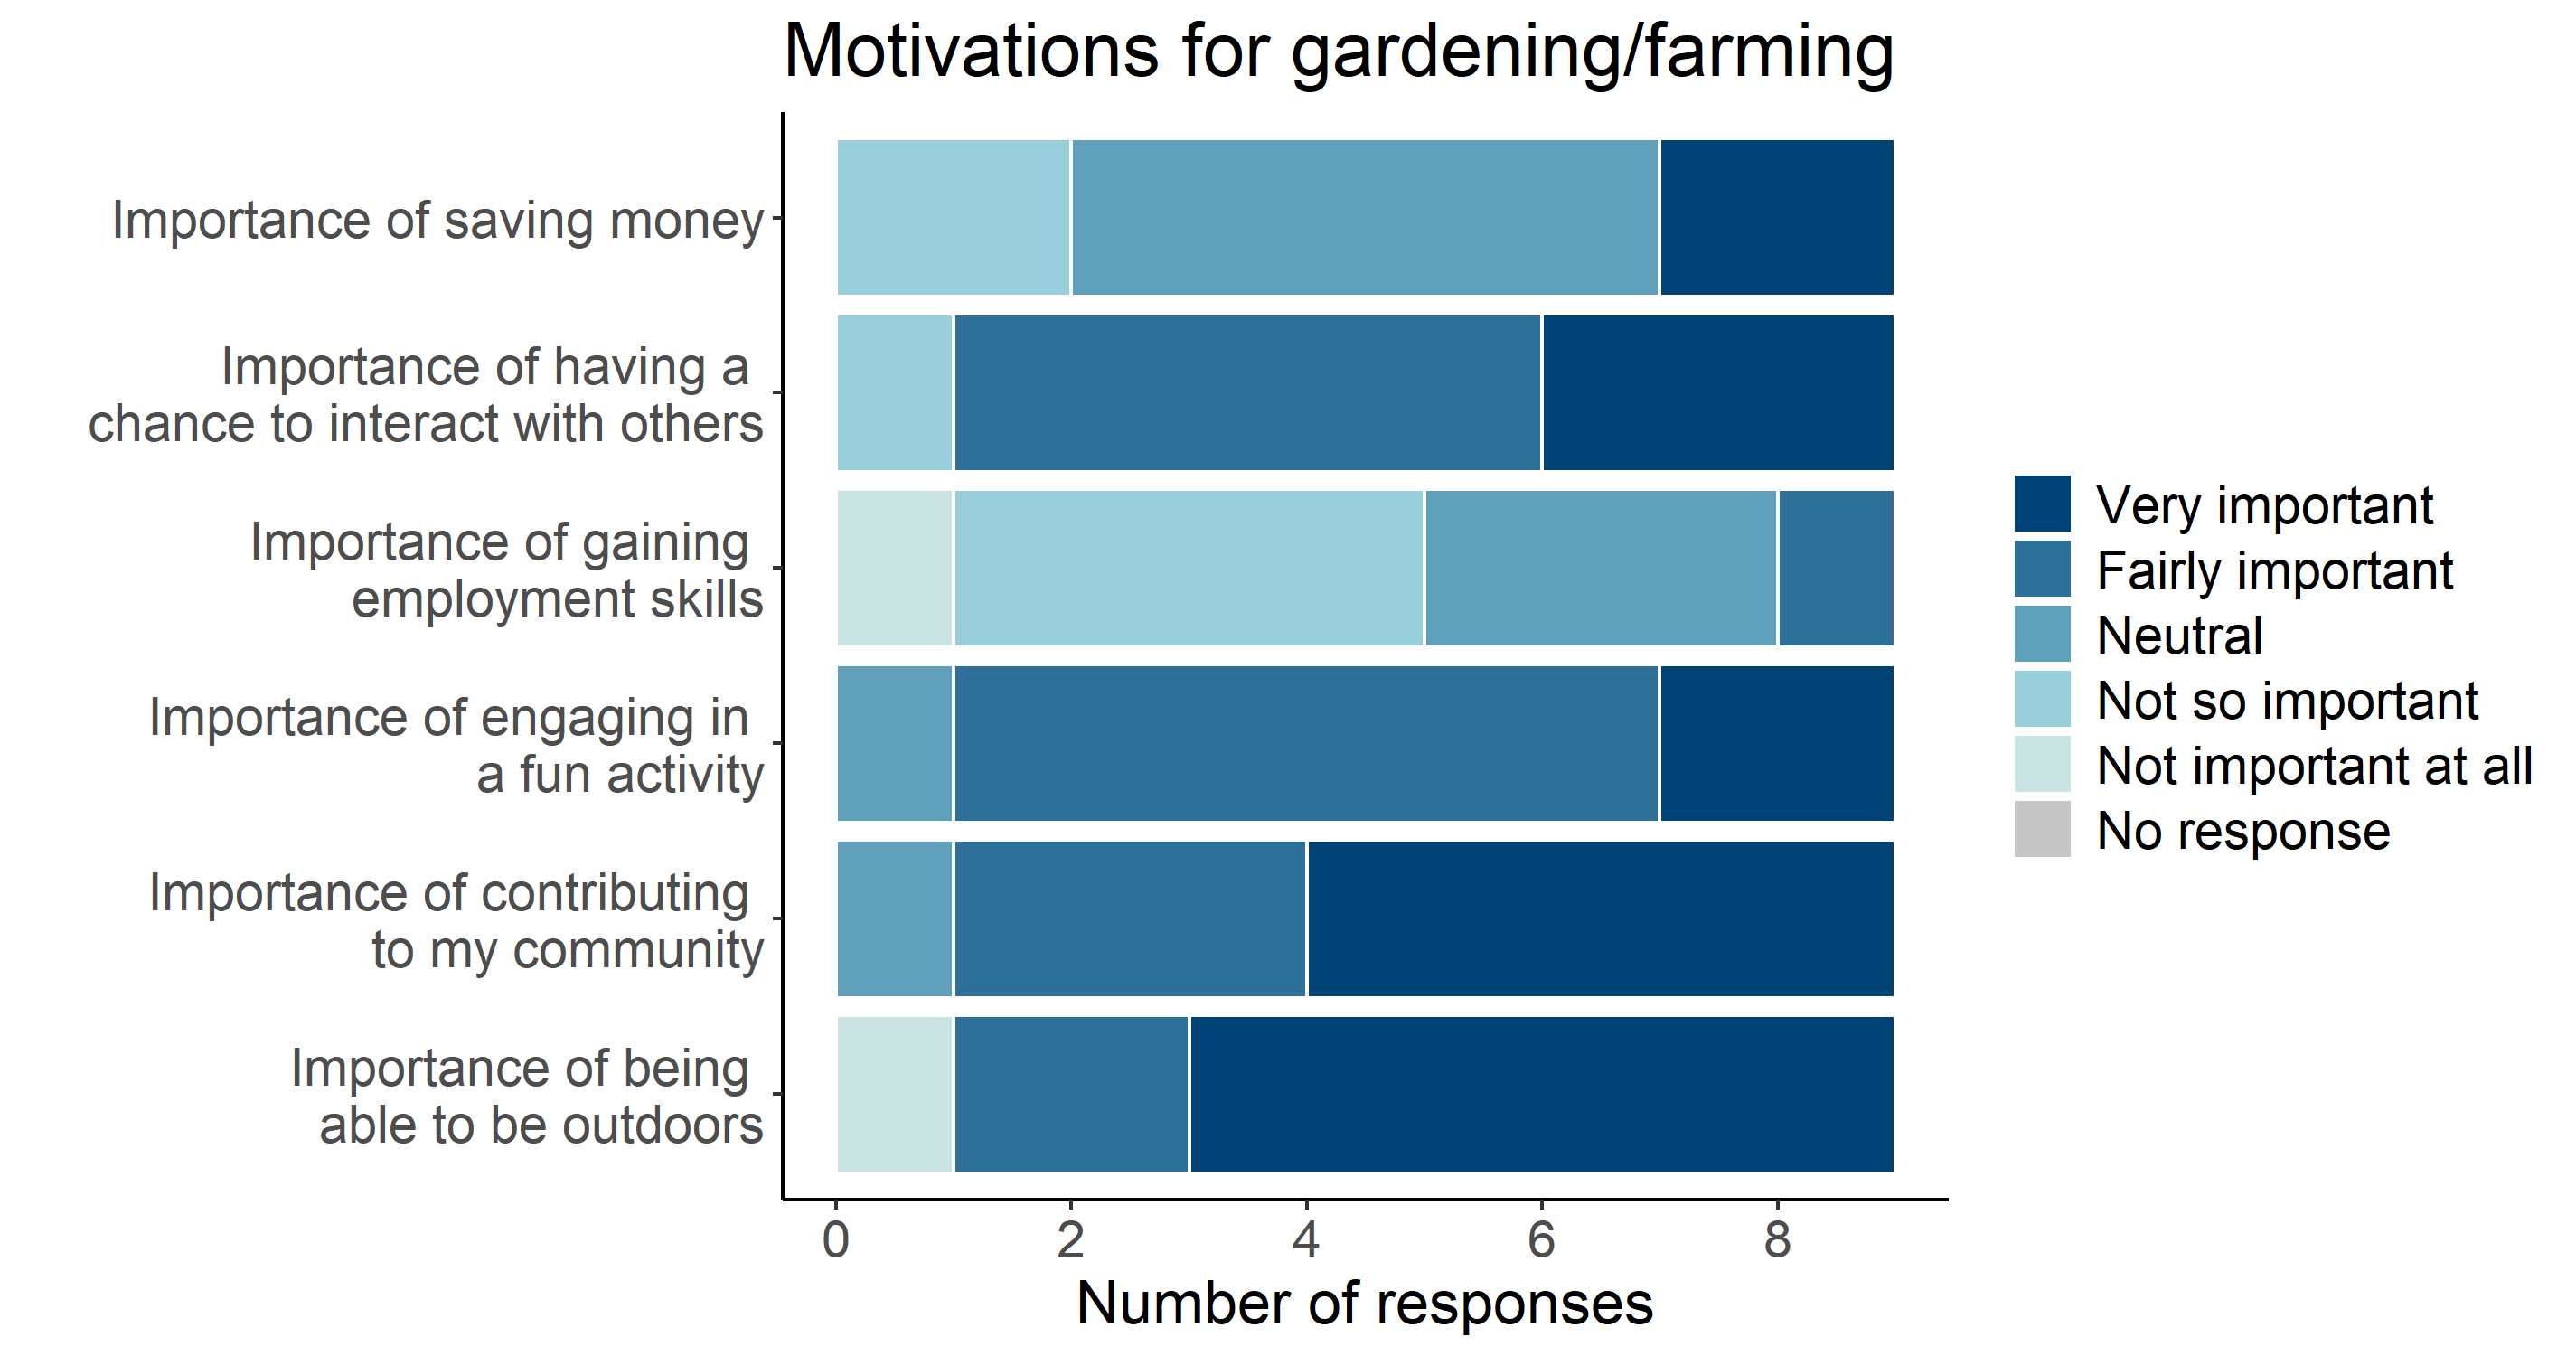
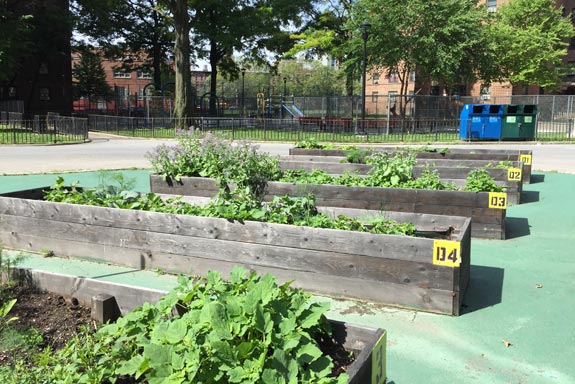
Wagner Houses Farm is a 1/3-acre (1349 m2) farm built in 2016 on the Wagner Houses campus, a New York City Housing Authority (NYCHA) development in East Harlem. The farm was built and is operated by young public housing residents (ages 18-24) who are part of a federal public service program called AmeriCorps Green City Force that provides professional development and skill-building opportunities with an emphasis on sustainability and community cohesion; the farm is also partnered with community-based organization Harlem Grown, a non-profit focused on nutritional literacy, food justice, and healthy food access for Harlem youth, which assists in farm management and programming. The farm aims to achieve four goals: youth development and workforce training, landscape transformation, community engagement, and improved nutrition and dietary behaviors among residents. The farm hosts farm stands twice a week, giving the produce harvested at the farm to public housing residents for free in exchange for their food scraps for composting or volunteer time at the farm. The farm also hosts cooking demonstrations and other nutritional programming, farm-based learning for school children, and community events like harvest festivals and volunteer days. The farm uses raised beds to grow crops and adheres to environmentally sustainable farming practices, using strategies like companion planting and integrated pest management. The organization managing the community farm is committed to achieving a closed-loop metabolism, aiming to ultimately integrate captured rainwater and locally produced compost in the operation of the farm. While the farm site itself does not have the infrastructure for compost production, in order to keep food scrap drop-off accessible to residents, they have a partnership with the New York Department of Sanitation (DSNY) who picks up and processes food scraps.
DASHBOARD
'The charts included in this ‘dashboard’ show resources that have been used to grow food on the area cultivated with edible crops, the quantity of food that has been grown and the perceived immaterial benefits accrued through gardening, between March 2019 and the end of November 2020. Charts are based on the data that gardeners have collected with much dedication'.
WATER
The water chart visualises in a bar the progressive consumption of water and electricity across some months of the year, together with the consumption per meter squared of food production area and kilogram of food harvested. The scale on the vertical axis of each chart shows the overall consumption. The total water consumption for this case study was calculated as an estimate based on water flow rate and time per week spent watering; the consumption is reported as a total over the whole season.
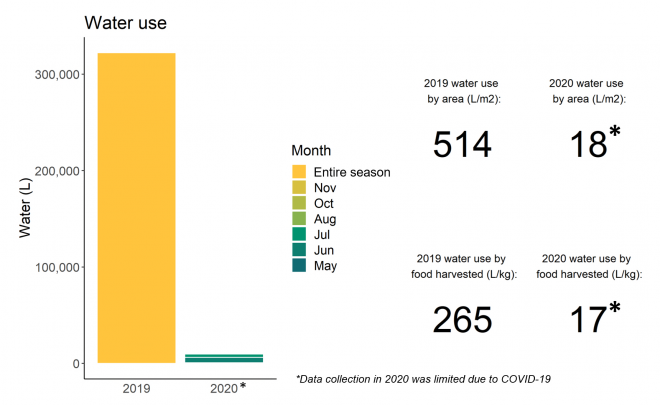
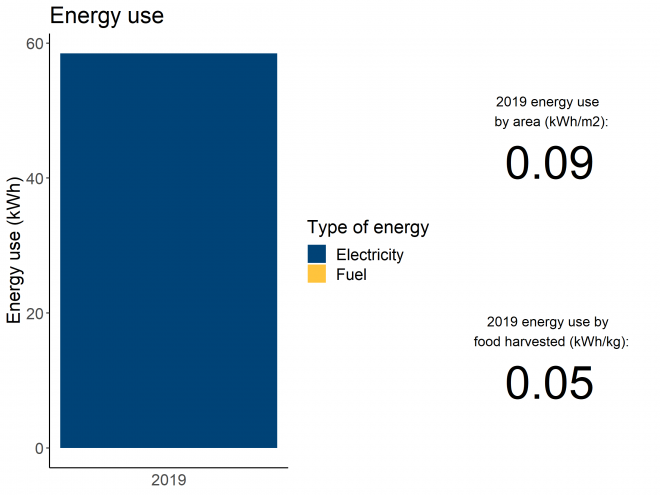
FOOD
The harvest chart, rather than showing harvest per month, shows the weight of the crops that were picked together with the quantity of kilograms per meter squared of food production area, which gives an indication of the intensity of production.
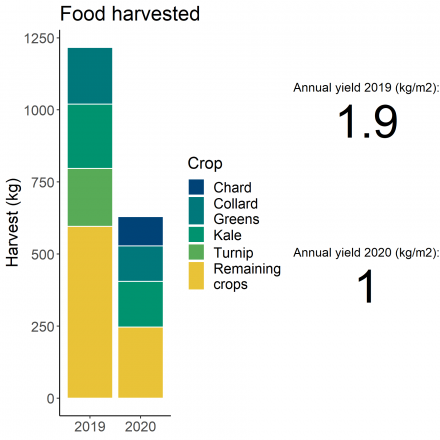
TRANSPORT
We have added a chart for trips to the garden, which in some cases generate a considerable consumption of fuel. This chart, however, needs to be interpreted. For example, in big cities such as New York or London, public transport is sometimes unavoidable and the quantity of kilometres may be also a consequence of the willingness of volunteers who do not live next to the garden to travel long distances. It may also indicate that a particular garden attracts many volunteers.
![]()
IMPACTS AND MOTIVATIONS
Finally, we have included two charts that show the motivations that most drive volunteers and gardeners to dedicate their time to grow food as well as the related impact on their wellbeing. The charts refer to answers given by all US case study participants and not to one single allotment plot holder.
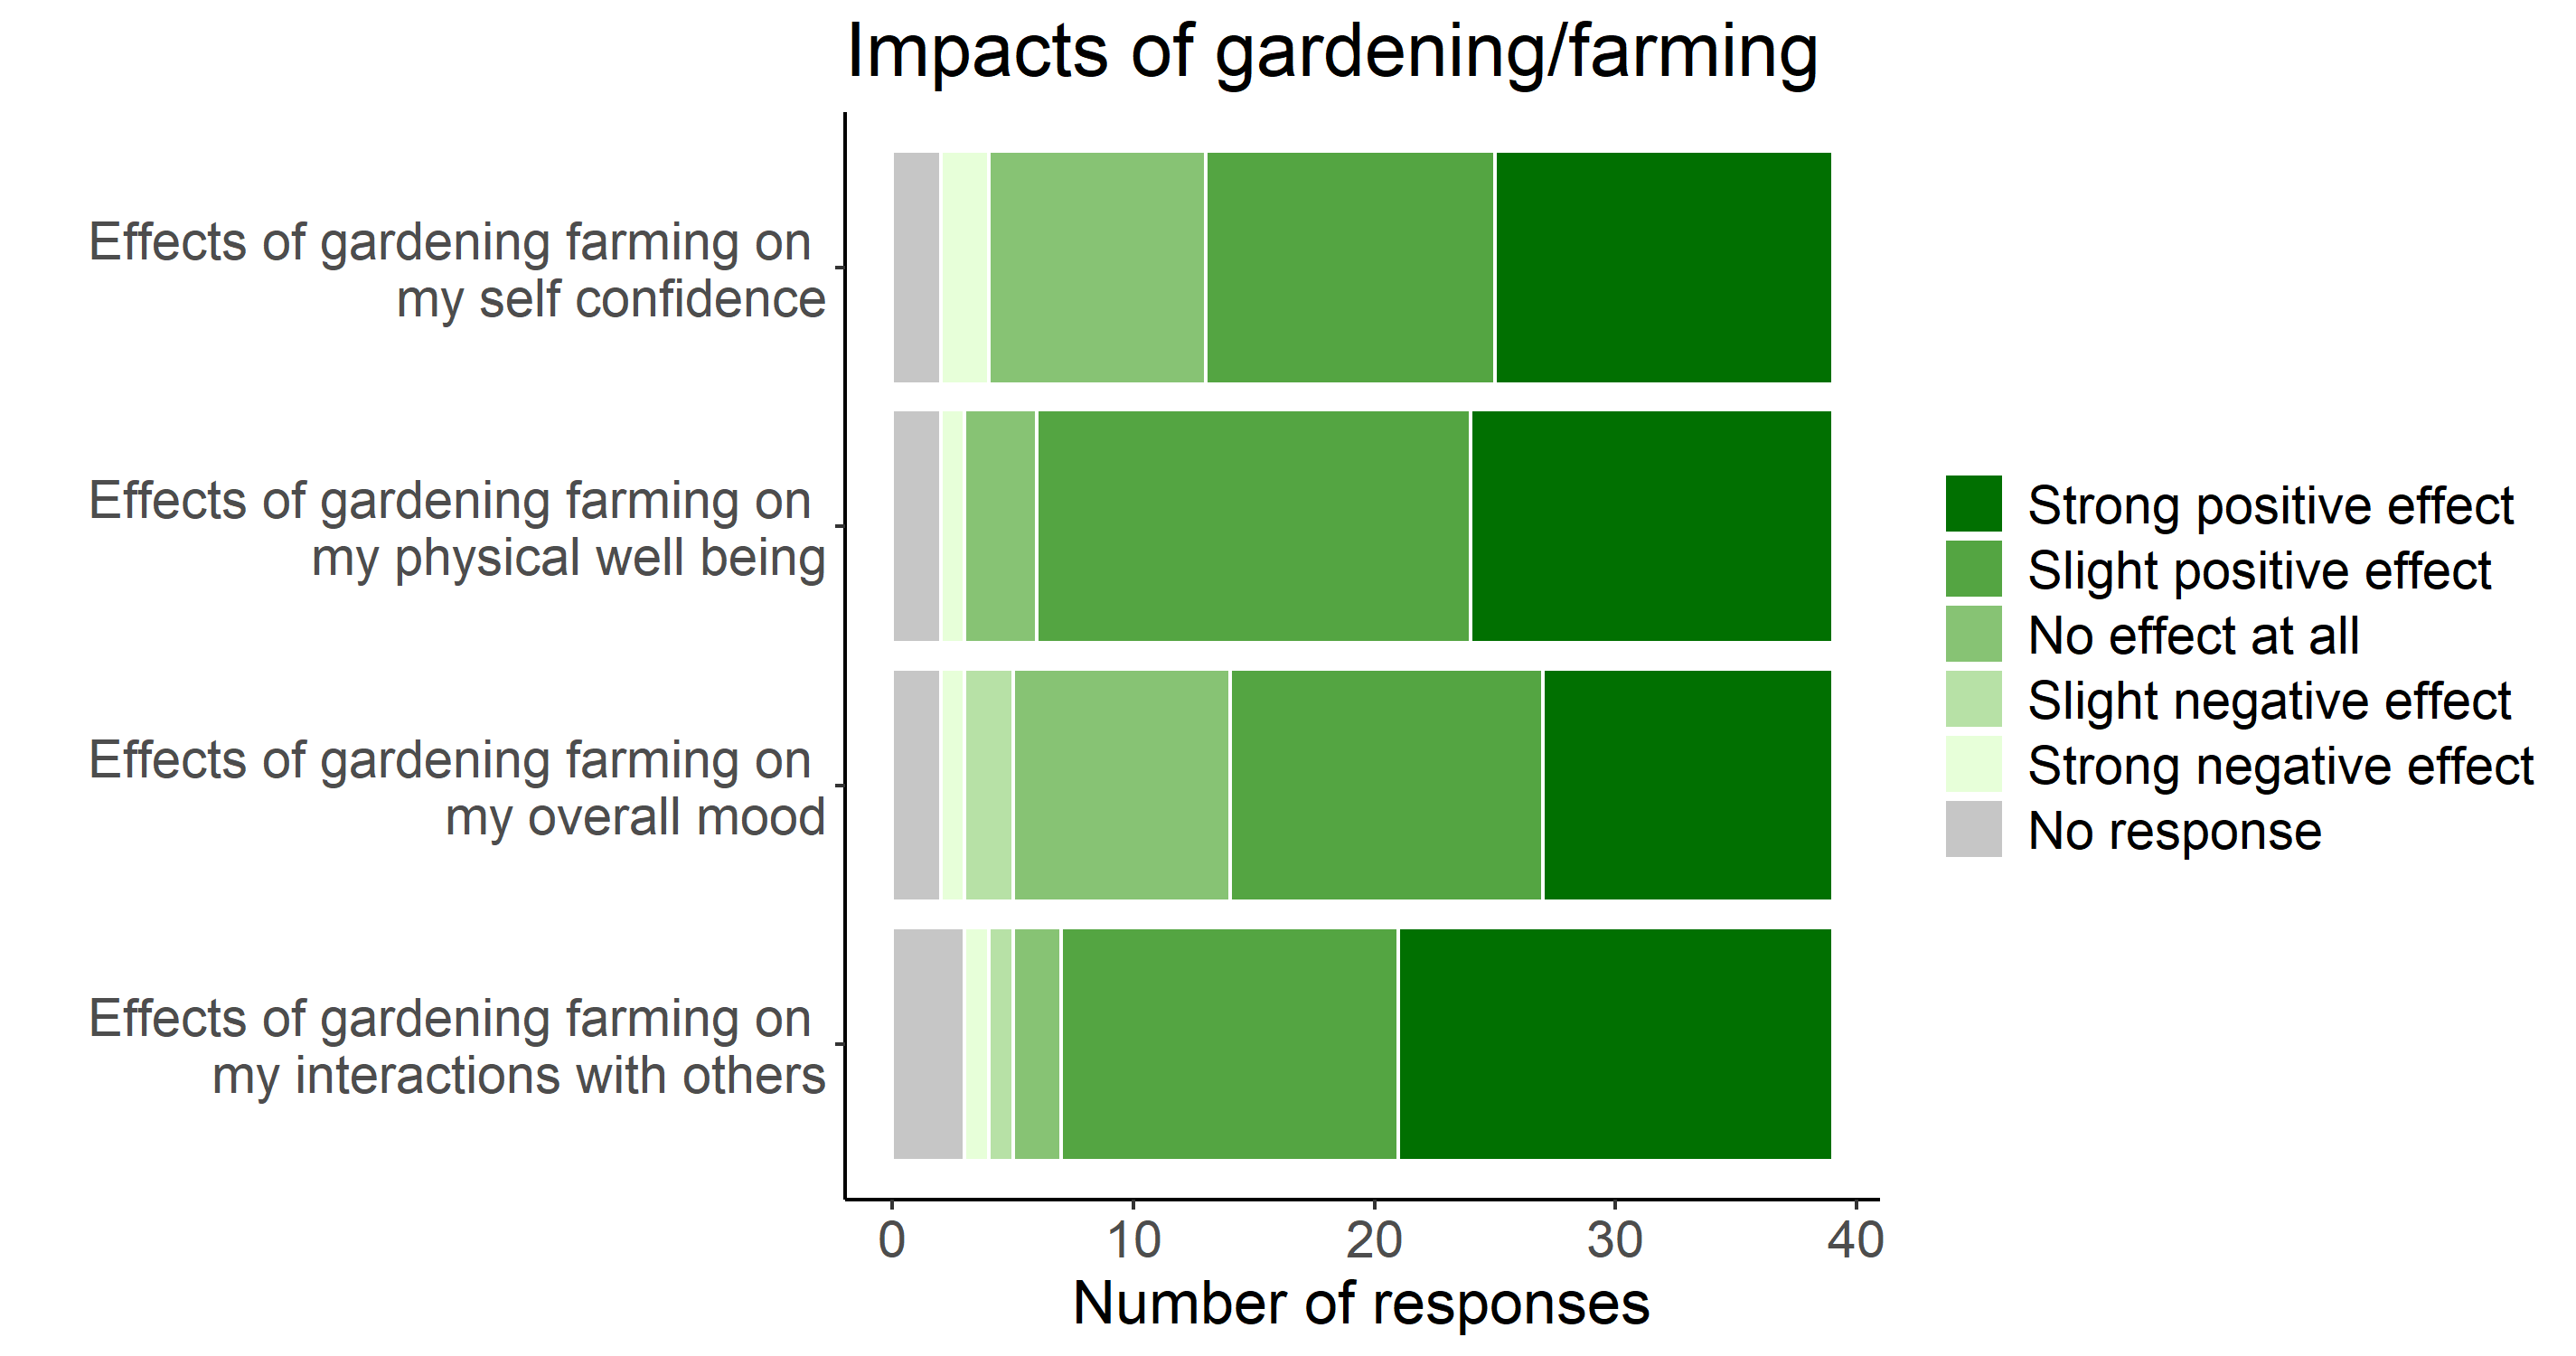
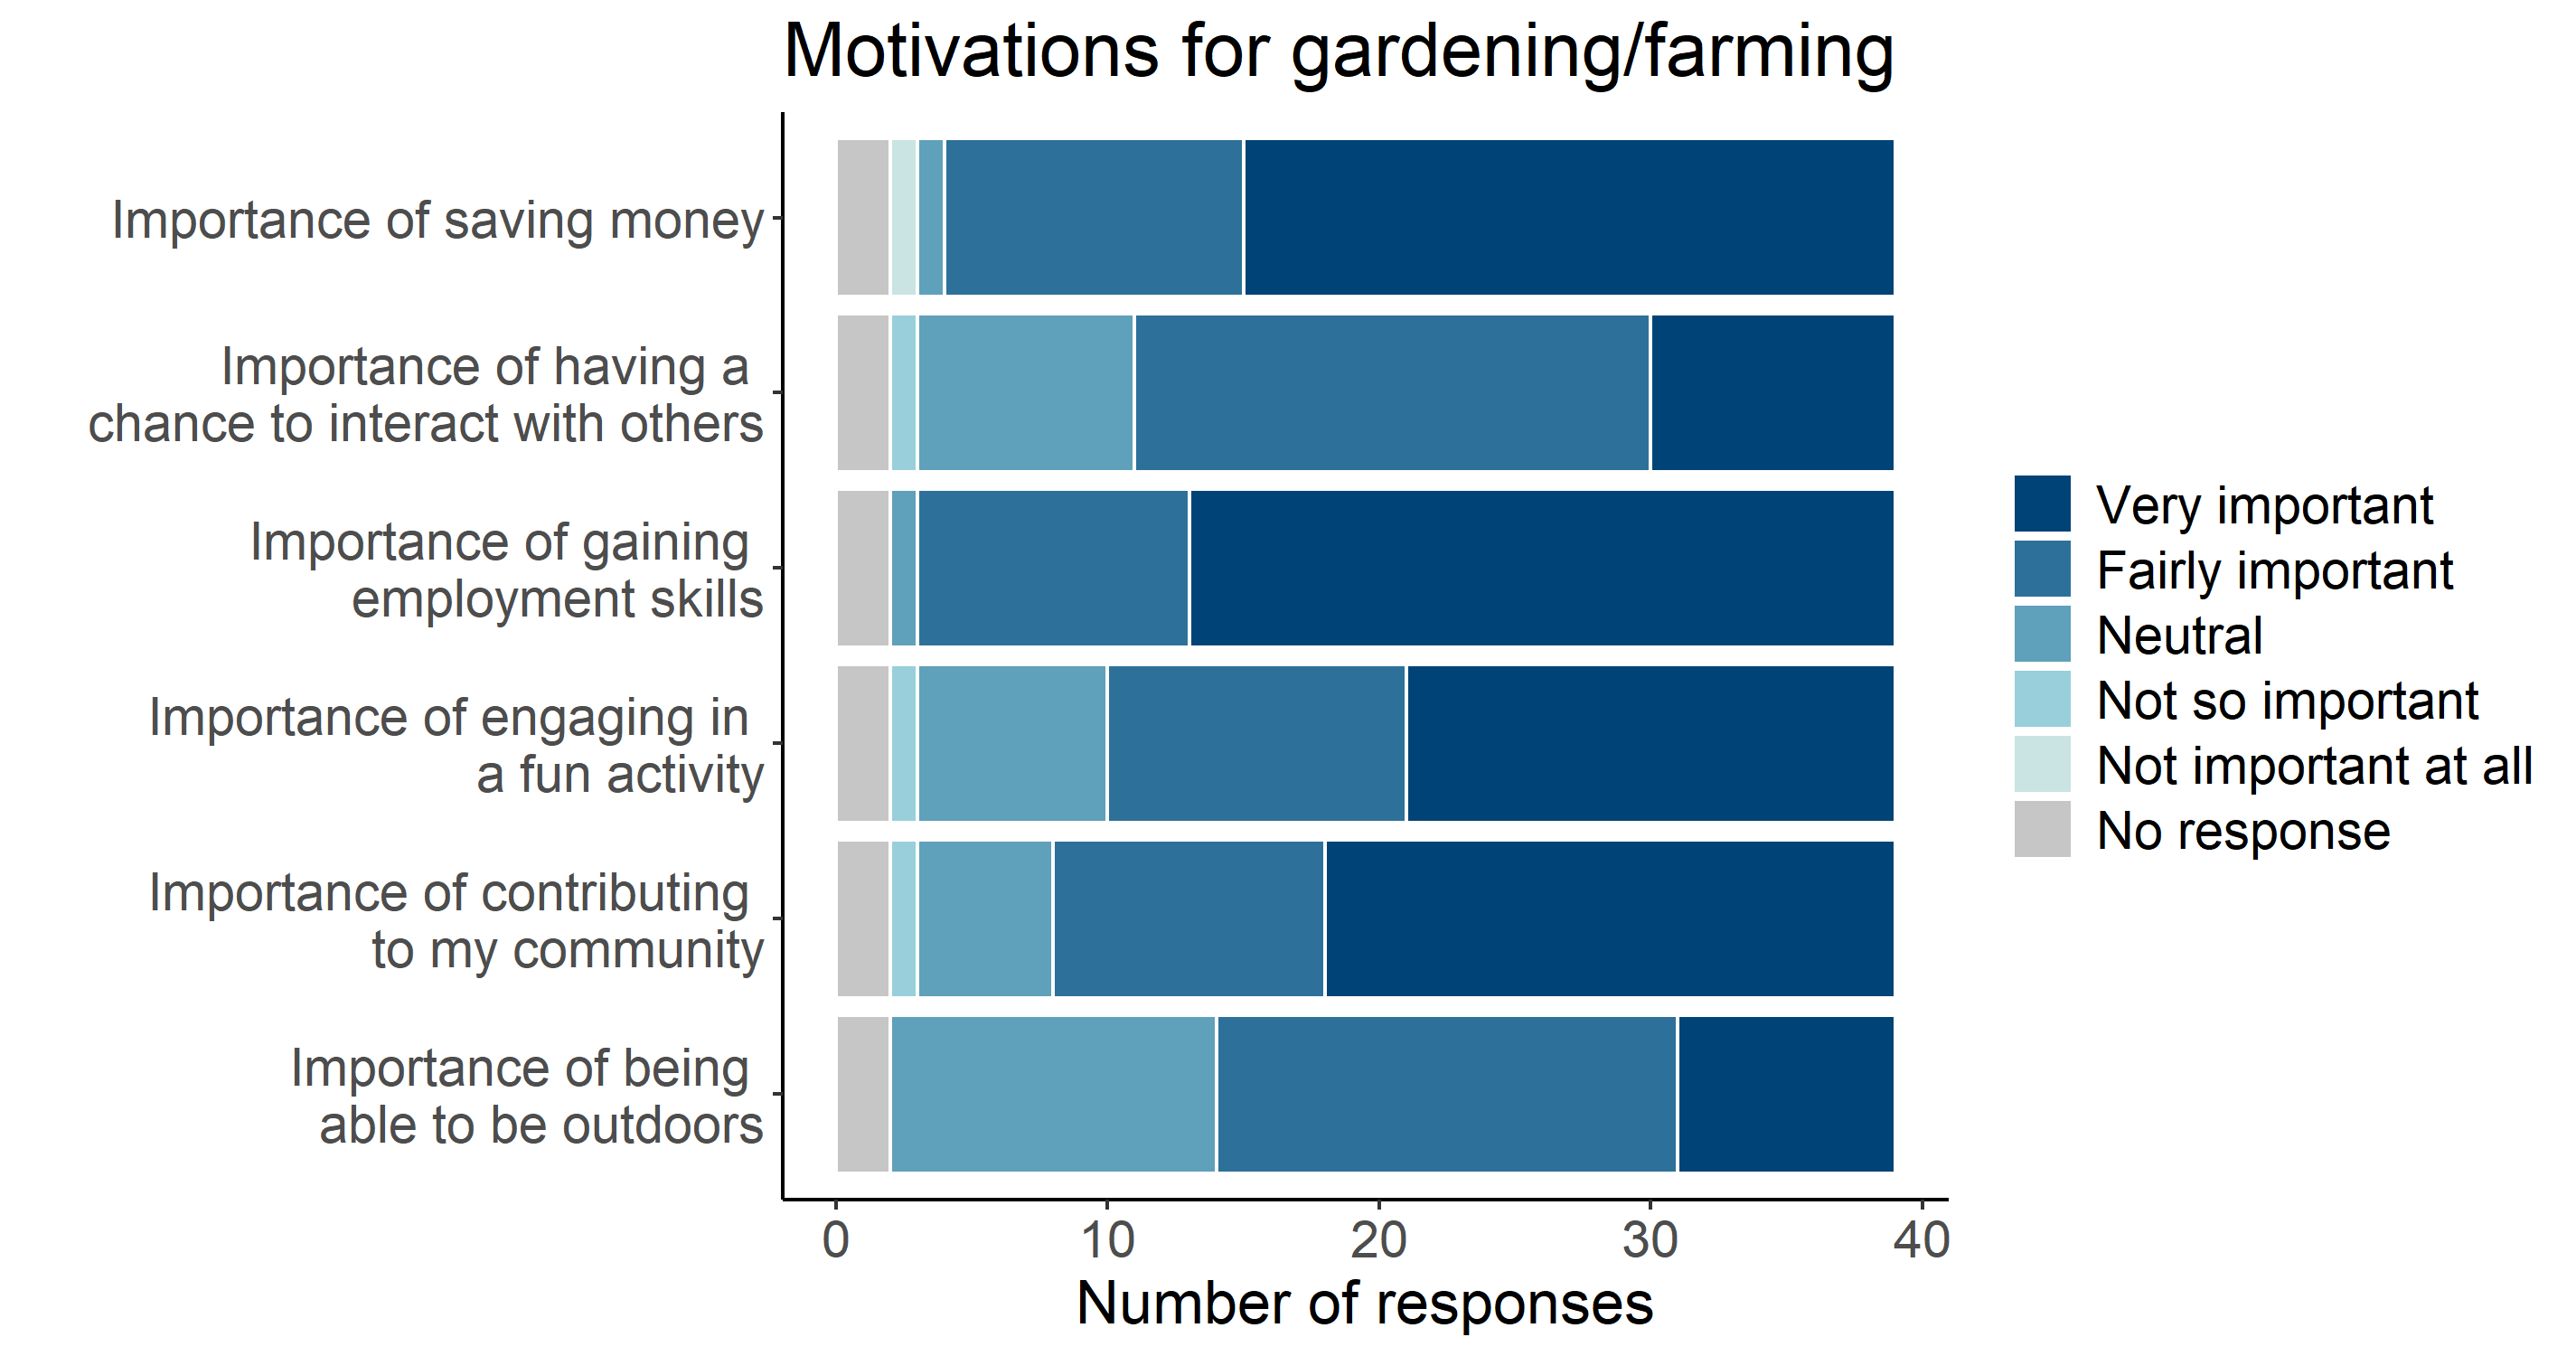
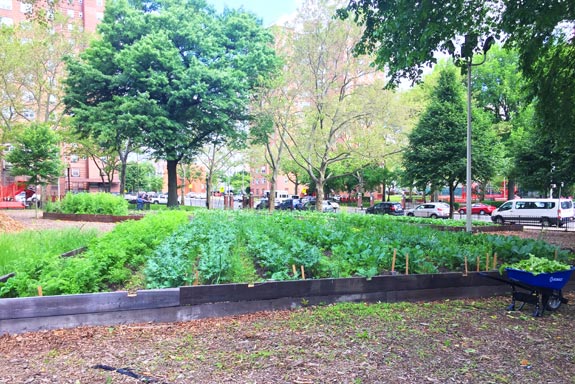
Forest Houses Farm is a 1 1/3-acre (5396 m2) farm built in 2017 on the Forest Houses campus, a NYCHA development in the Morrisania neighborhood of the Bronx. The farm was built and is operated by young public housing residents (ages 18-24) who are part of a federal public service program called AmeriCorps Green City Force that provides professional development and skill-building opportunities with an emphasis on sustainability and community cohesion; the farm is also partnered with community-based organization La Finca del Sur, an urban farming cooperative led by Latina and Black women in the South Bronx. The farm aims to achieve four goals: youth development and workforce training, landscape transformation, community engagement, and improved nutrition and dietary behaviors among residents. The farm hosts farm stands twice a week, giving the produce harvested at the farm to public housing residents for free in exchange for their kitchen scraps for composting or volunteer time at the farm. The youth also host cooking demonstrations and other nutritional programming, farm-based learning for school children, and community events like harvest festivals and volunteer days. The farm uses raised beds to grow crops and adheres to environmentally sustainable farming practices, using strategies like companion planting and integrated pest management. The organization managing the community farm is committed to achieving a closed-loop metabolism, aiming to ultimately integrate captured rainwater and compost produced on-site in the operation of the farm.
DASHBOARD
‘The charts included in this ‘dashboard’ show resources that have been used to grow food on the area cultivated with edible crops, the quantity of food that has been grown and the perceived immaterial benefits accrued through gardening, between March 2019 and the end of November 2020. Charts are based on the data that gardeners have collected with much dedication’.
WATER
The water chart visualises in a bar the progressive consumption of water and electricity across some months of the year, together with the consumption per meter squared of food production area and kilogram of food harvested. The scale on the vertical axis of each chart shows the overall consumption. The total water consumption for this case study was calculated as an estimate based on water flow rate and time per week spent watering; the consumption is reported as a total over the whole season.
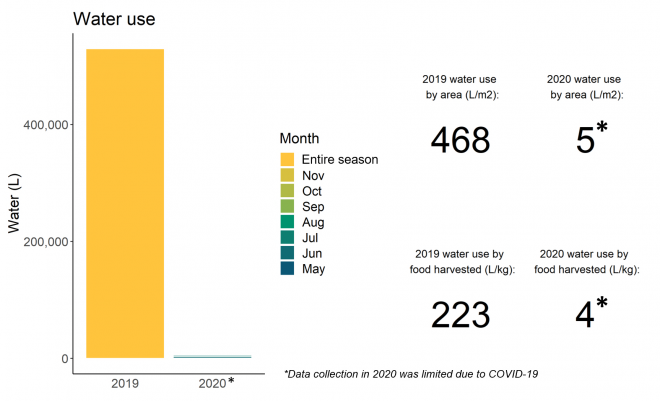
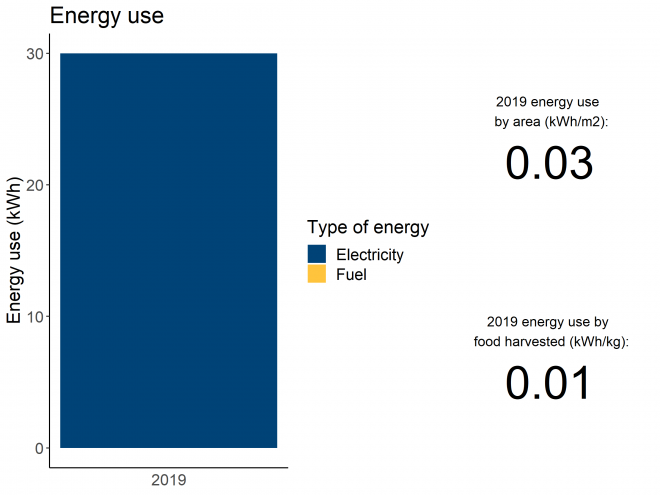
FOOD
The harvest chart, rather than showing harvest per month, shows the weight of the crops that were picked together with the quantity of kilograms per meter squared of food production area, which gives an indication of the intensity of production.
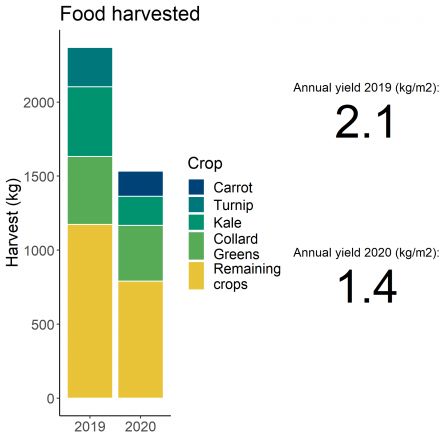
TRANSPORT
We have added a chart for trips to the garden, which in some cases generate a considerable consumption of fuel. This chart, however, needs to be interpreted. For example, in big cities such as New York or London, public transport is sometimes unavoidable and the quantity of kilometres may be also a consequence of the willingness of volunteers who do not live next to the garden to travel long distances. It may also indicate that a particular garden attracts many volunteers.
![]()
IMPACTS AND MOTIVATIONS
‘Finally, we have included two charts that show the motivations that most drive volunteers and gardeners to dedicate their time to grow food as well as the related impact on their wellbeing. The charts refer to answers given by all US case study participants and not to one single allotment plot holder'.
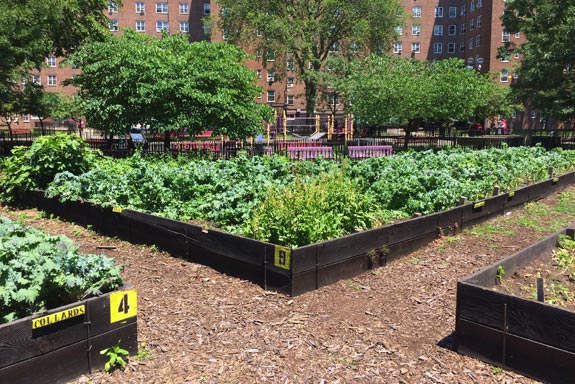
The Red Hook Houses Farm is a 1 acre (4046 m2) farm built in 2013 on the Red Hook West Houses campus, a NYCHA development in Red Hook, Brooklyn. The farm was built and is operated by young public housing residents (ages 18-24) who are part of a federal public service program called AmeriCorps Green City Force that provides professional development and skill-building opportunities with an emphasis on sustainability and community cohesion; the farm is partnered with community-based organization the Red Hook Initiative (formerly Added Value) who also run a companion farm in the neighborhood. The farm aims to achieve four goals: youth development and workforce training, landscape transformation, community engagement, and improved nutrition and dietary behaviors among residents. The farm hosts farm stands once a week, giving the produce harvested at the farm to public housing residents for free in exchange for their kitchen scraps for composting or volunteer time at the farm. The youth also host cooking demonstrations and other nutritional programming, farm-based learning for school children, and community events like harvest festivals and volunteer days. The farm uses raised beds to grow crops and adheres to environmentally sustainable farming practices, using strategies like companion planting and integrated pest management. The organization managing the community farm is committed to achieving a closed-loop metabolism, aiming to ultimately integrate captured rainwater and compost produced on-site in the operation of the farm.
DASHBOARD
‘The charts included in this ‘dashboard’ show resources that have been used to grow food on the area cultivated with edible crops, the quantity of food that has been grown and the perceived immaterial benefits accrued through gardening, between March 2019 and the end of November 2020. Charts are based on the data that gardeners have collected with much dedication’.
WATER
The water chart visualises in a bar the progressive consumption of water and electricity across some months of the year, together with the consumption per meter squared of food production area and kilogram of food harvested. The scale on the vertical axis of each chart shows the overall consumption. The total water consumption for this case study was calculated as an estimate based on water flow rate and time per week spent watering; the consumption is reported as a total over the whole season.
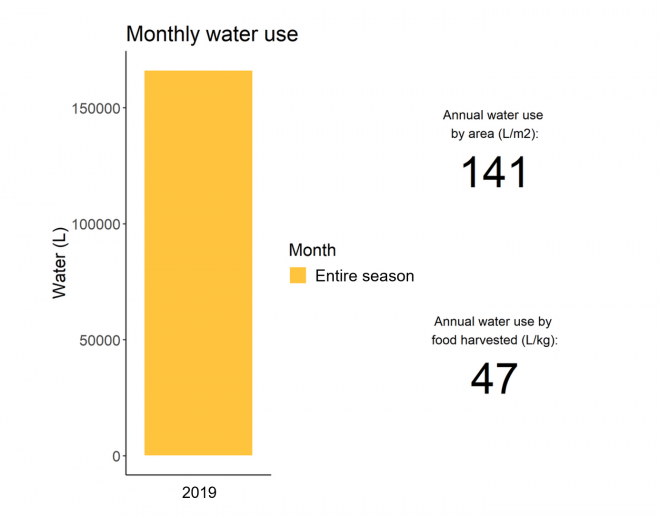
FOOD
The harvest chart, rather than showing harvest per month, shows the weight of the crops that were picked together with the quantity of kilograms per meter squared of food production area, which gives an indication of the intensity of production.
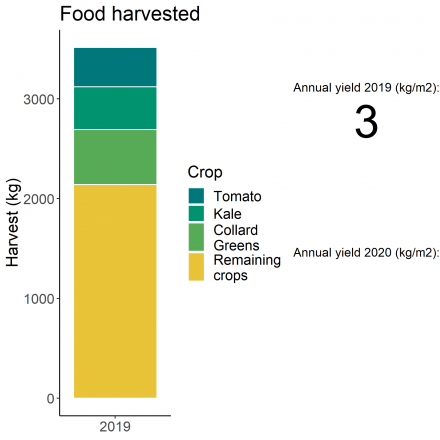
TRANSPORT
We have added a chart for trips to the garden, which in some cases generate a considerable consumption of fuel. This chart, however, needs to be interpreted. For example, in big cities such as New York or London, public transport is sometimes unavoidable and the quantity of kilometres may be also a consequence of the willingness of volunteers who do not live next to the garden to travel long distances. It may also indicate that a particular garden attracts many volunteers.
![]()
IMPACTS AND MOTIVATIONS
‘Finally, we have included two charts that show the motivations that most drive volunteers and gardeners to dedicate their time to grow food as well as the related impact on their wellbeing. The charts refer to answers given by all US case study participants and not to one single allotment plot holder'.
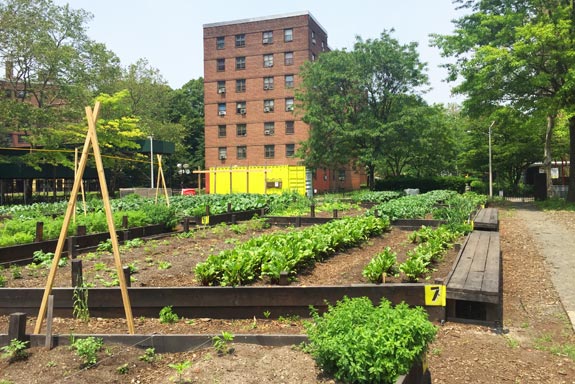
The Howard Houses Farm is a ¾ acre (3035 m2) farm built in 2016 on the Howard Houses campus, a NYCHA development in Brownsville, Brooklyn. The farm was built and is operated by young public housing residents (ages 18-24) who are part of a federal public service program called AmeriCorps Green City Force that provides professional development and skill-building opportunities with an emphasis on sustainability and community cohesion; the farm is also partnered with community-based organization the Isabahlia Ladies of Elegance Foundation, a non-profit dedicated to strengthening community families in honor of Isabahlia Martin Oritz. The farm aims to achieve four goals: youth development and workforce training, landscape transformation, community engagement, and improved nutrition and dietary behaviors among residents. The farm hosts farm stands twice a week, giving the produce harvested at the farm to public housing residents for free in exchange for their kitchen scraps for composting or volunteer time at the farm. The youth also host cooking demonstrations and other nutritional programming, farm-based learning for school children, and community events like harvest festivals and volunteer days. The farm uses raised beds to grow crops and adheres to environmentally sustainable farming practices, using strategies like companion planting and integrated pest management. The organization managing the community farm is committed to achieving a closed-loop metabolism, aiming to ultimately integrate captured rainwater and compost produced on-site in the operation of the farm.
DASHBOARD
‘The charts included in this ‘dashboard’ show resources that have been used to grow food on the area cultivated with edible crops, the quantity of food that has been grown and the perceived immaterial benefits accrued through gardening, between March 2019 and the end of November 2020. Charts are based on the data that gardeners have collected with much dedication’.
WATER
The water chart visualises in a bar the progressive consumption of water and electricity across some months of the year, together with the consumption per meter squared of food production area and kilogram of food harvested. The scale on the vertical axis of each chart shows the overall consumption. The total water consumption for this case study was calculated as an estimate based on water flow rate and time per week spent watering; the consumption is reported as a total over the whole season.
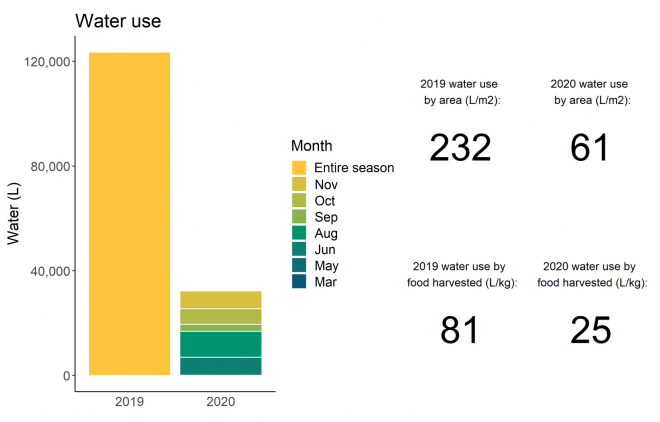

FOOD
The harvest chart, rather than showing harvest per month, shows the weight of the crops that were picked together with the quantity of kilograms per meter squared of food production area, which gives an indication of the intensity of production.
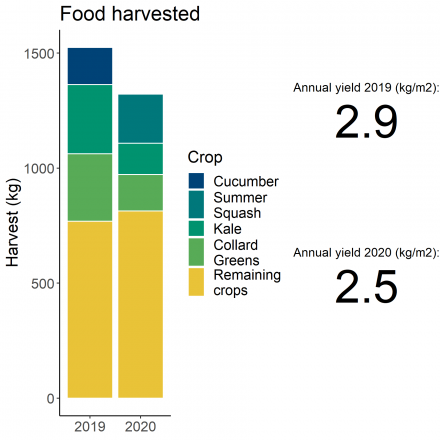
TRANSPORT
We have added a chart for trips to the garden, which in some cases generate a considerable consumption of fuel. This chart, however, needs to be interpreted. For example, in big cities such as New York or London, public transport is sometimes unavoidable and the quantity of kilometres may be also a consequence of the willingness of volunteers who do not live next to the garden to travel long distances. It may also indicate that a particular garden attracts many volunteers.
![]()
IMPACTS AND MOTIVATIONS
‘Finally, we have included two charts that show the motivations that most drive volunteers and gardeners to dedicate their time to grow food as well as the related impact on their wellbeing. The charts refer to answers given by all US case study participants and not to one single allotment plot holder'.
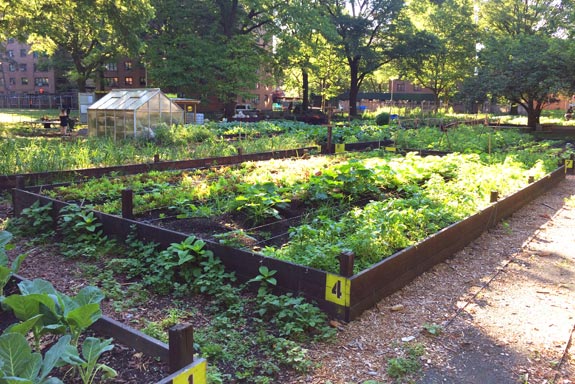
The Bay View Houses farm is a 2 acre (8094 m2) farm built in 2016 on the Bay View Houses campus, a NYCHA development in Canarsie, Brooklyn. The farm was built and is operated by young public housing residents (ages 18-24) who are part of a federal public service program called AmeriCorps Green City Force that provides professional development and skill-building opportunities with an emphasis on sustainability and community cohesion; the farm is also partnered with East New York Farms, a non-profit whose mission centers around food justice, local sustainable agriculture, and community-led economic development. The farm aims to achieve four goals: youth development and workforce training, landscape transformation, community engagement, and improved nutrition and dietary behaviors among residents. The farm hosts farm stands twice a week, giving the produce harvested at the farm to public housing residents for free in exchange for their kitchen scraps for composting or volunteer time at the farm. The youth also host cooking demonstrations and other nutritional programming, farm-based learning for school children, and community events like harvest festivals and volunteer days. The farm uses raised beds to grow crops and adheres to environmentally sustainable farming practices, using strategies like companion planting and integrated pest management. The organization managing the community farm is committed to achieving a closed-loop metabolism, aiming to ultimately integrate captured rainwater and compost produced on-site in the operation of the farm.
DASHBOARD
‘The charts included in this ‘dashboard’ show resources that have been used to grow food on the area cultivated with edible crops, the quantity of food that has been grown and the perceived immaterial benefits accrued through gardening, between March 2019 and the end of November 2020. Charts are based on the data that gardeners have collected with much dedication’.
WATER
The water chart visualises in a bar the progressive consumption of water and electricity across some months of the year, together with the consumption per meter squared of food production area and kilogram of food harvested. The scale on the vertical axis of each chart shows the overall consumption.
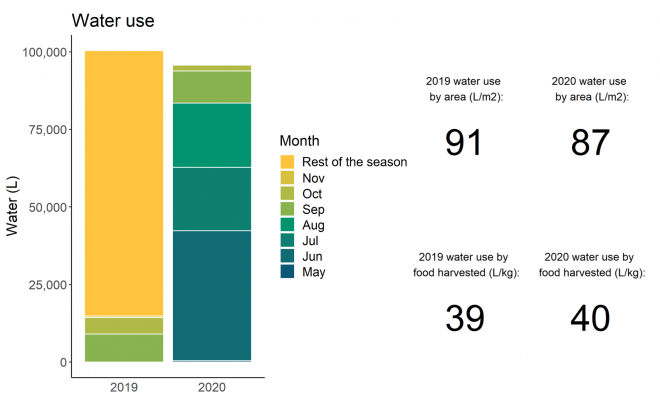
FOOD
The harvest chart, rather than showing harvest per month, shows the weight of the crops that were picked together with the quantity of kilograms per meter squared of food production area, which gives an indication of the intensity of production.
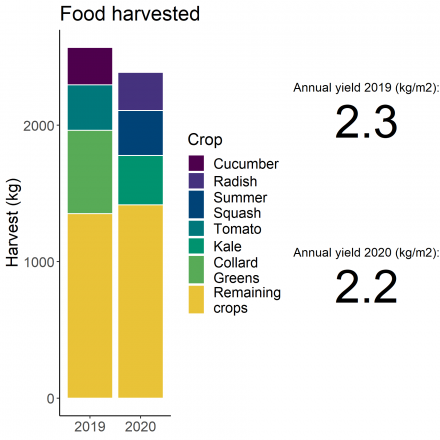
TRANSPORT
We have added a chart for trips to the garden, which in some cases generate a considerable consumption of fuel. This chart, however, needs to be interpreted. For example, in big cities such as New York or London, public transport is sometimes unavoidable and the quantity of kilometres may be also a consequence of the willingness of volunteers who do not live next to the garden to travel long distances. It may also indicate that a particular garden attracts many volunteers.
![]()
IMPACTS AND MOTIVATIONS
Finally, we have included two charts that show the motivations that most drive volunteers and gardeners to dedicate their time to grow food as well as the related impact on their wellbeing. The charts refer to answers given by all German case study participants and not to one single allotment plot holder.
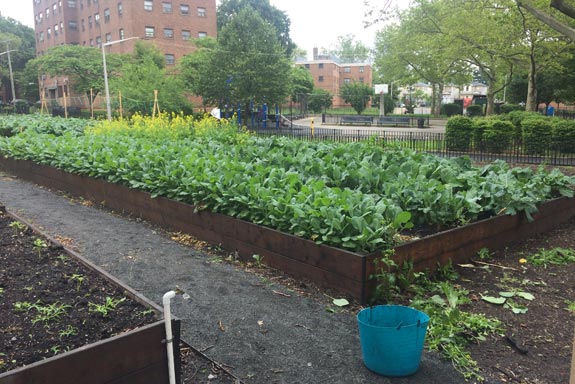
The Mariner's Harbor Houses Farm is a 1 acre (4046 m2) farm built in 2018 on the Mariners Harbor Houses campus, a NYCHA development in North Shore, Staten Island. The farm was built and is operated by young public housing residents (ages 18-24) who are part of a federal public service program called AmeriCorps Green City Force that provides professional development and skill-building opportunities with an emphasis on sustainability and community cohesion. The farm aims to achieve four goals: youth development and workforce training, landscape transformation, community engagement, and improved nutrition and dietary behaviors among residents. The farm hosts farm stands twice a week, giving the produce harvested at the farm to public housing residents for free in exchange for their kitchen scraps for composting or volunteer time at the farm. The youth also host cooking demonstrations and other nutritional programming, farm-based learning for school children, and community events like harvest festivals and volunteer days. The farm uses raised beds to grow crops and adheres to environmentally sustainable farming practices, using strategies like companion planting and integrated pest management. The organization managing the community farm is committed to achieving a closed-loop metabolism, aiming to ultimately integrate captured rainwater and compost produced on-site in the operation of the farm.
DASHBOARD
‘The charts included in this ‘dashboard’ show resources that have been used to grow food on the area cultivated with edible crops, the quantity of food that has been grown and the perceived immaterial benefits accrued through gardening, between March 2019 and the end of November 2020. Charts are based on the data that gardeners have collected with much dedication’.
WATER
The water chart visualises in a bar the progressive consumption of water and electricity across some months of the year, together with the consumption per meter squared of food production area and kilogram of food harvested. The scale on the vertical axis of each chart shows the overall consumption.
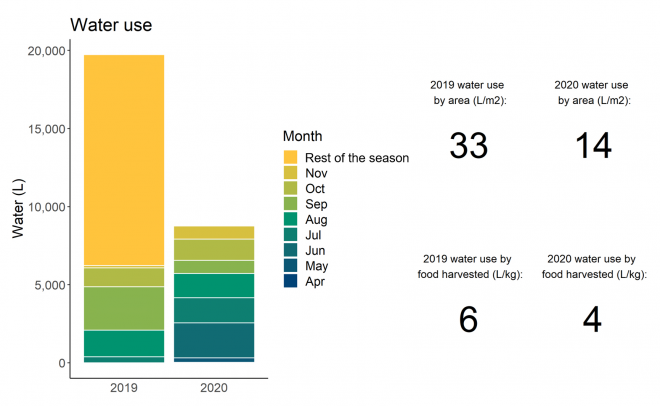

FOOD
The harvest chart, rather than showing harvest per month, shows the weight of the crops that were picked together with the quantity of kilograms per meter squared of food production area, which gives an indication of the intensity of production.
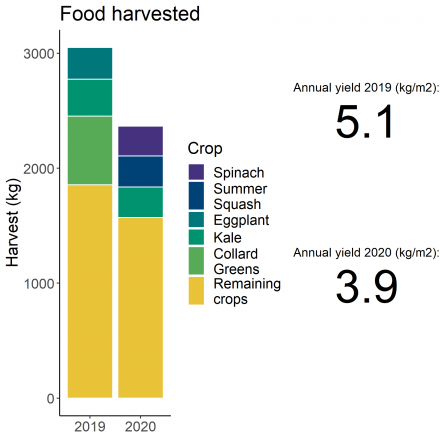
TRANSPORT
We have added a chart for trips to the garden, which in some cases generate a considerable consumption of fuel. This chart, however, needs to be interpreted. For example, in big cities such as New York or London, public transport is sometimes unavoidable and the quantity of kilometres may be also a consequence of the willingness of volunteers who do not live next to the garden to travel long distances. It may also indicate that a particular garden attracts many volunteers.
![]()
IMPACTS AND MOTIVATIONS
‘Finally, we have included two charts that show the motivations that most drive volunteers and gardeners to dedicate their time to grow food as well as the related impact on their wellbeing. The charts refer to answers given by all US case study participants and not to one single allotment plot holder'.